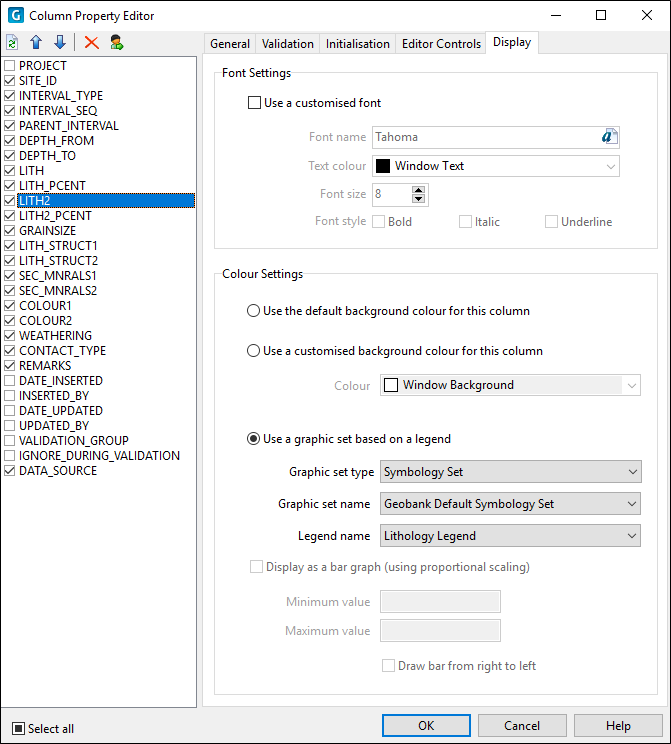
Column Properties: Display
This topic describes how to set the display properties of the columns in a dataset. In the following example, the properties of two columns in the TableLithology dataset are configured.
On the Configuration | Datasets page of the Data View Property Editor:
- Select the Lithology table and click on the Column Properties button.

- In the Column Property Editor, click on the Display tab.
- Select the LITH column from the Columns list.
- Select the Use a colour or hatch pattern based on a legend option.
- Set the Graphic set type to Symbology.
- Set the Graphic set of the column to SymbologySet.
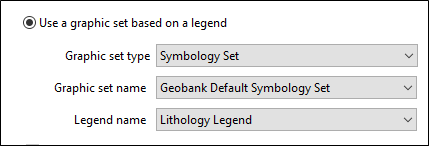
- Set the Legend name of the column to CoalLegendLith.
- Select the LITH_PCENT column.
- Select the Use a customised background colour for this column option.
- Select the Money Green colour
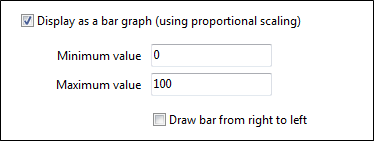
- Select the Display as a bar graph option and set the scale of the graph from 0 (Minimum) to 100 (maximum).
- Click OK to confirm your changes to the properties of the columns in the TableLithology dataset and click OK to close the Configuration Manager.
When you refresh the data view, the properties you have set for the LITH and LITH_PCENT columns of the TableLithology dataset are applied as shown below:
