|

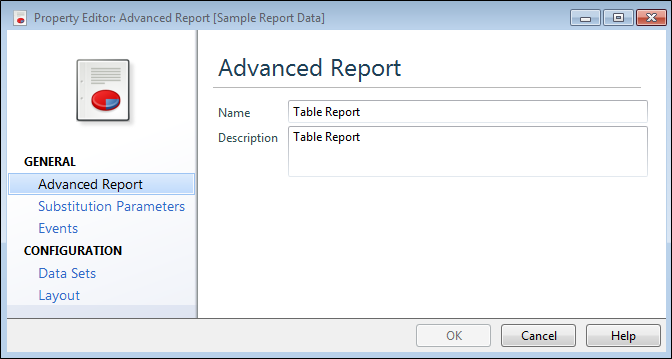
- Create a new Advanced Report or open an existing one.
- Fill in the Name and Description.
Create a Table Report
- Double-click on the Data Sets link.
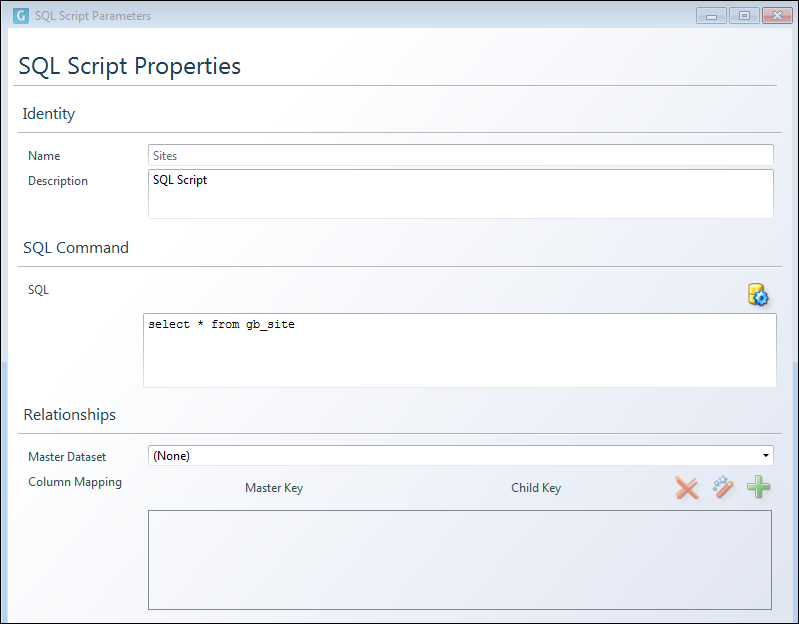
- Click the plus icon to add a new Data Set.
- Fill in the SQL Script Properties form as shown below, then click OK.
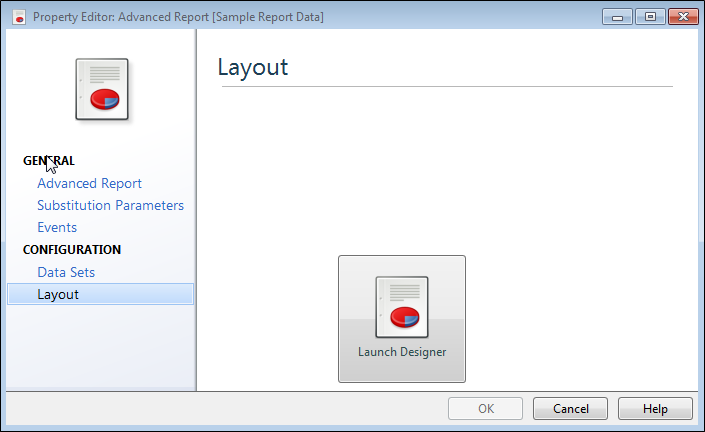
- Select Layout and click on the Launch Designer icon to bring up the Report Designer screen.
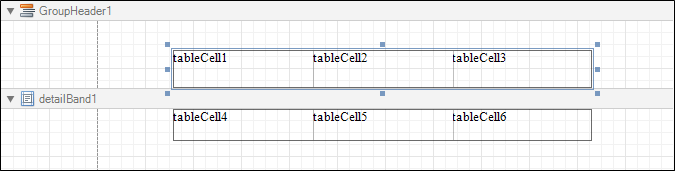
- Add two Table controls to the PageHeader and Detail bands of the report.
To do this, open the Toolbox Standard Controls tab and click the Table item. Then, in the GroupHeader band, click and hold down the left mouse button while dragging the cursor across the detailBand1 band. You could achieve the same result by individually setting up two tables, one in the Group Header1 band and another in detailBand1.
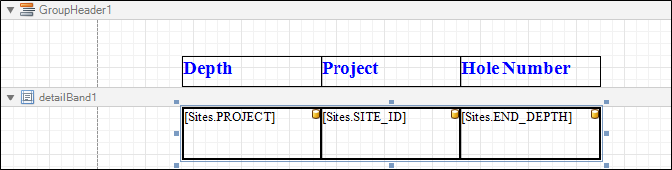
The result will look like the following:
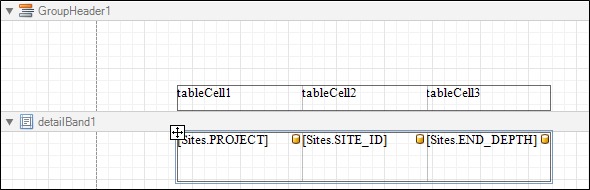
- Drag and drop the PROJECT, SITE_ID and END_DEPTH fields from the Field List window into the table cells as shown below:
Bind Table Columns to Fields in the Database
- Double-click in tableCell1 and enter the appropriate column label, Project in this case. Repeat for the remaining table's cells with the labels Hole Number and Hole Depth.
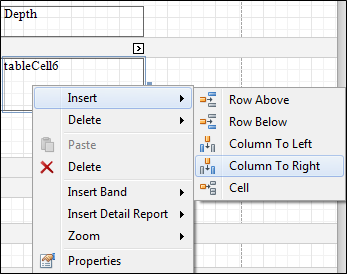
If you want to add a column to the table, right-click in the right-hand side table cell, select Insert and then select Column to Right in the drop-down menu
Rearrange Table Cells using Report Explorer
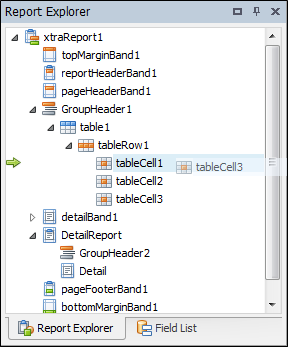
The Report Explorer gives you a graphical view of the structure of the report, including the relative positions of Report Bands and the Controls contained within them.
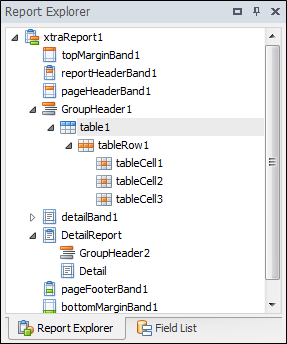
- Use drag and drop to move tableCell3 above tableCell1 in tableRow1.
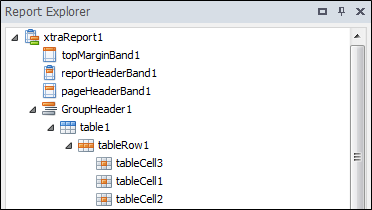
The result is shown below:
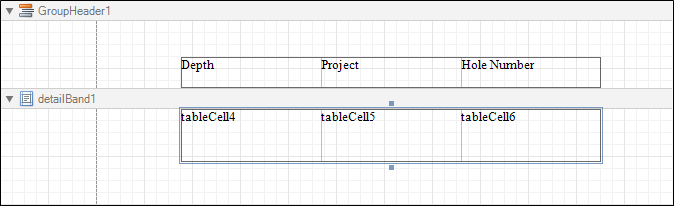
In the report, the table heading cells have also been automatically shifted as shown below:
- Move the cells back to their original position.
- Change the cell size by clicking on a table boundary and dragging the cell to the desired size. Using this method you can alter both the width and height properties of a cell. Resize to the original.
To improve the appearance of the report, you can customise certain table parameters.
- Select the cells for the tables data cells.
The properties box is located to the right of the Report Designer and will show the properties for the selected cell.
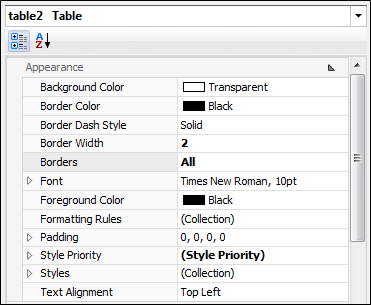
- Define values for the Borders properties of both tables (set Borders All ).
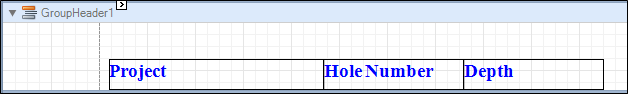
- Customise text appearance for each table header cell, using the formatting toolbar. Set the font size to 14, select Bold text and change the colour of the text to blue

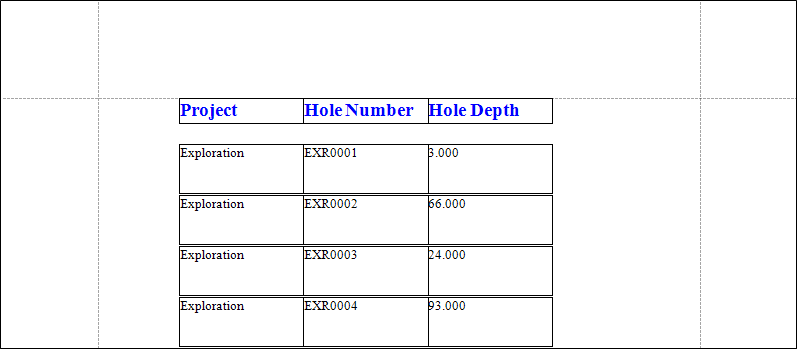
Now, the report layout has the following look.
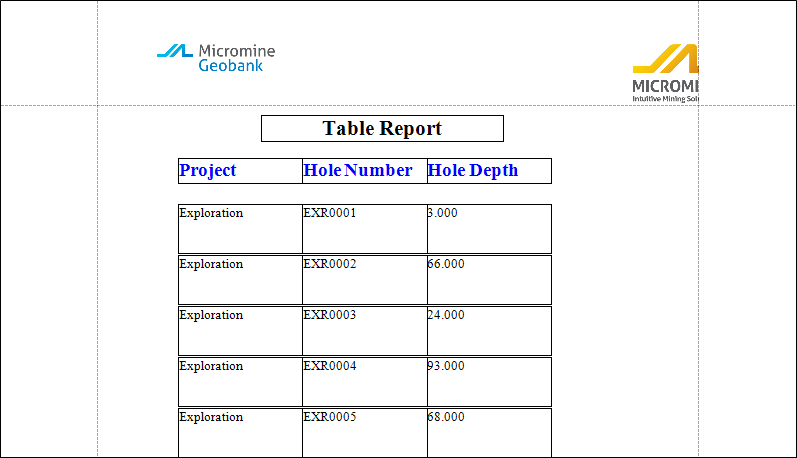
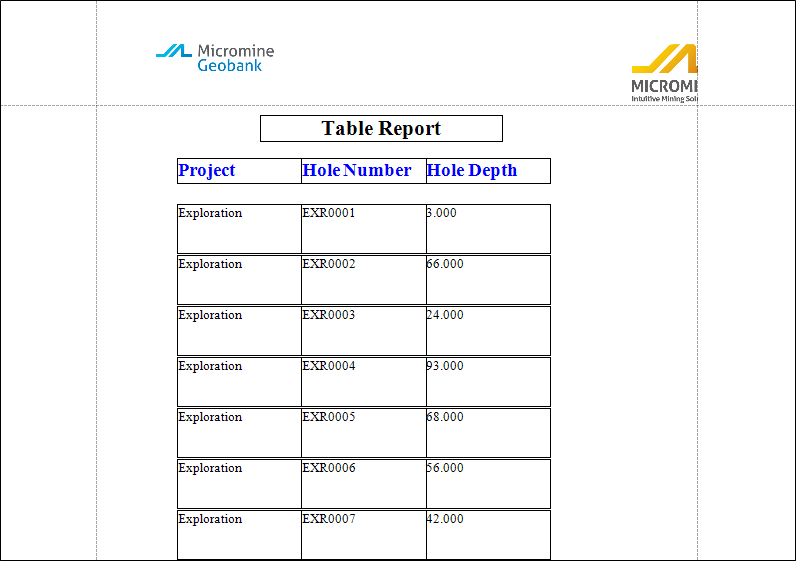
- View the final report by clicking on the Print Preview tab. It will look like the image below:
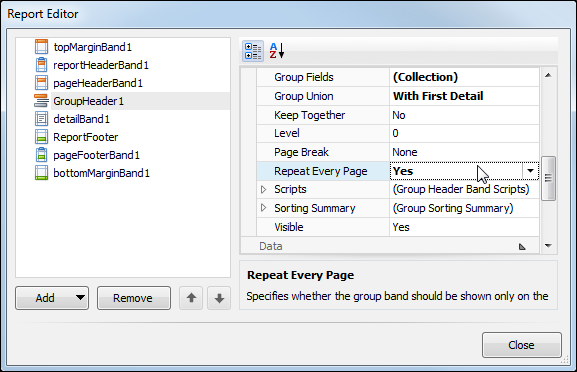
Repeat Every Page Property
This property specifies whether the group band should be shown only on the first page that the group appears on or on every page that the group is printed on. Set this property to Yes if the group band should be shown on every page; otherwise its is set to the default value of No.
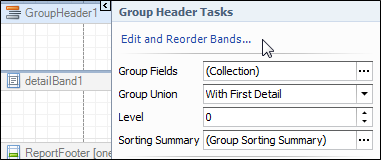
- To set the property to Yes, click on the smart tag for GroupHeader1, select Edit and reorder bands...
- In the Report Editor, set the value of the Repeat Every Page property to Yes.
The following report output demonstrates the use of the Repeat Every Page property. Notice that the header band, which is seen in the Blue text, is repeated on every page.
If the Repeat Every Page property is set to No, the following output is seen. Notice that the header is only displayed on the first page.