Event Column
The recording of downhole events is often important, both from an exploration and a mining point of view. These observations are usually based on physical attributes, e.g. structural and geotechnical properties, or other secondary indicators, such as fossils.
Use Symbols to Denote Downhole Events
The Event Graphic Column template (and in this version, the Text Column) allow for the graphic representation of downhole event data. These templates work in much the same way as the standard graphic column. However, the graphic symbol is shown as a small rectangle at the point where the event was recorded.
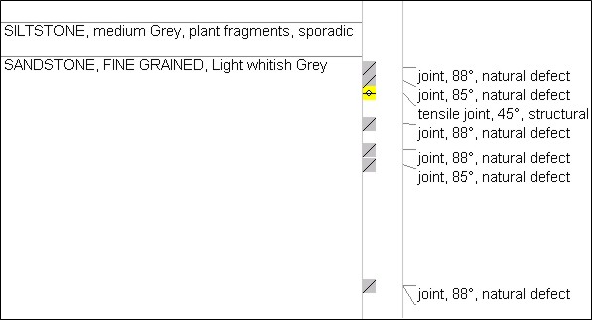
The event or text column can also be used to display other properties, such as contact types (erosional, gradational, discordant, etc.). The column can be used as an overlay on a graphic column or a bar graph.
In cases where several events occur at the same depth, the event boxes are rearranged to fit into the available space. You should therefore allow some extra space when specifying the width of the template. In some cases, however, it may be necessary to increase the scale in order to avoid over-plotting.
To use this template effectively, you will have to design special symbols that are appropriately sized and oriented. The Graphic Reporter will not automatically rotate symbols based on, for example, the dip of a feature. One approach would be to devise a legend based on a combination of feature type and dip.