Graphics Report Data Connectivity
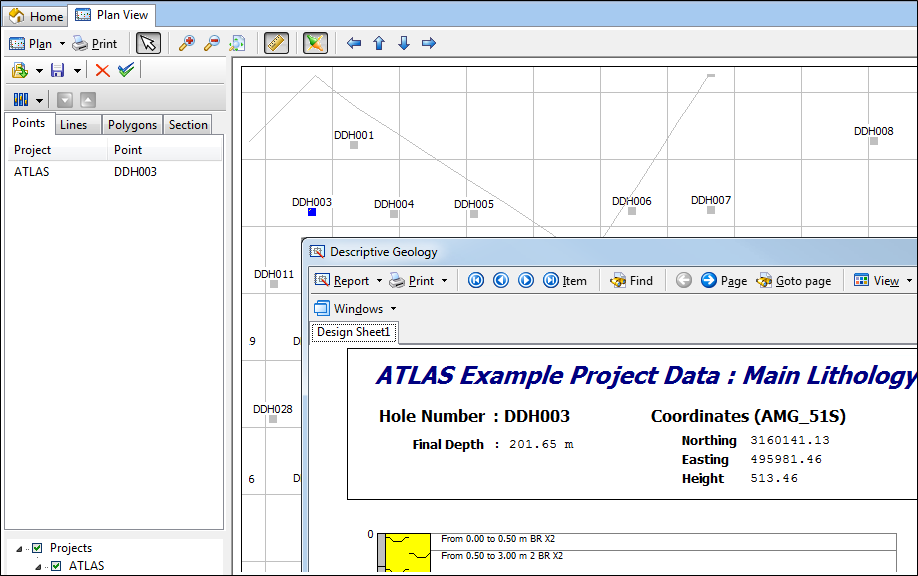
The Data Connectivity tool (on both the Plan View and the Graphic Reporter toolbars) can be used to spatially select a hole or a boundary that will be queried in a graphic report.
To establish Plan View connectivity, the first step is to setup the appropriate Find parameters for the report. This is done on the Connector page of the Graphic Report Property Editor.
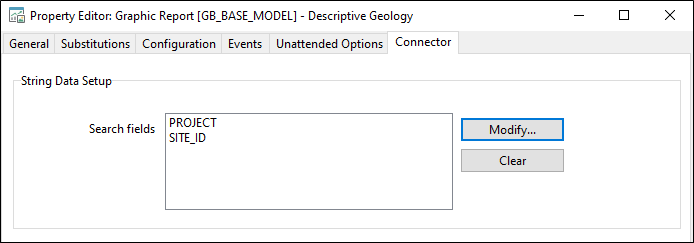
Click the Modify button to select the search fields that will be used to establish a connection between the report data and the data in the plan view.
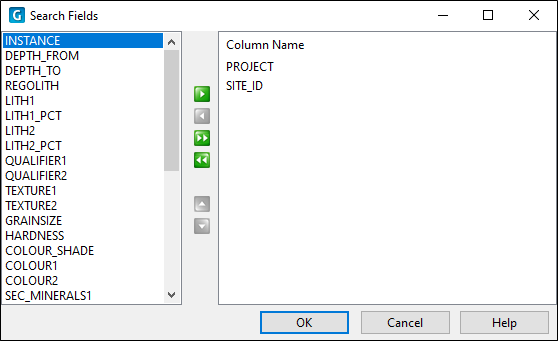
Typically, PROJECT and SITE_ID parameters are setup for a downhole report.
For a boundary, you would typically have something like PROJECT and ENTITY as your Find fields.
The Plan View utility can provide information to two types of Graphic Reporter drawings:
- If you click on a point representing a drillhole, it will position a downhole report on that hole if an active drawing is found.
- If you click inside a boundary, it can communicate the project and boundary codes to a drawing that deals with lease summaries, for example.
In the first case, the information sent to the drawing consists of the PROJECT code and SITE_ID; in the second case, the PROJECT code and boundary ENTITY code. This information is used by Graphic Reporter to find the appropriate record in the controlling dataset, in much the same way as the Find function would. (In fact, it is simply executing the Find function using the parameters supplied by the plan view.)
In order for Plan View connectivity to work, the plan view and the graphic report must both be open, the Connectivity buttons must be activated on both toolbars, and the controlling dataset of the graphic report must contain a primary key that matches the search fields that have been setup.