Properties: Scale Bar
When you execute a report, you can click the Scale Bar Properties button ![]() on the toolbar to specify how annotated values will be displayed along the scale bar.
on the toolbar to specify how annotated values will be displayed along the scale bar.
You are presented with the Scale Bar Properties dialog:
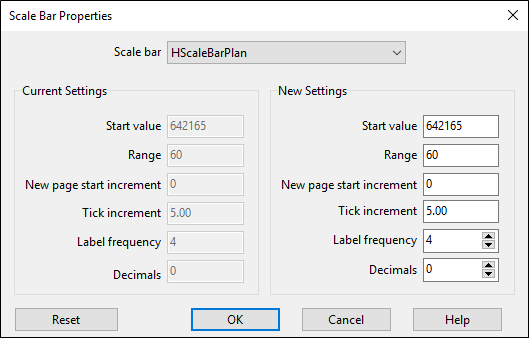
Scale bar
Select a scale bar from the list of scale bars associated with the report.
Start value
Enter a start value for the scale bar.
The horizontal or vertical scale of any scale bar is determined by the range of values defined for the scale bar. This in turn determines the scale of all templates that are associated with the scale bar.
In a typical graphic drillhole log, the depth range on the depth scale bar determines the vertical scale of most of the templates in the drawing. For example: assuming that the height of the depth scale bar is 200mm, a depth interval of 40 metres will result in a vertical scale of 1: 200.
For more information, refer to the Selecting a page or depth range topic.
Tick mark interval and label frequency
Specify the position and the frequency of annotations. A value of 1 indicates that every tick mark should be annotated; a value of 5 means that every fifth tick mark should be annotated.
Decimals
Specify how many (if any) decimal places are to be used by default when annotating values along the scale bar.
Optionally, select the Read from a field option and choose a dataset and a column, to read decimal precision values from a field. If field values are missing the default decimal precision will be used instead.
Reset
Click the Reset button to reset the current scale bar to its default properties.