Chart Axes
On the Axes tab you can set options to display a title for each axis, and optionally define the range of each axis. See: Advanced Axis Properties
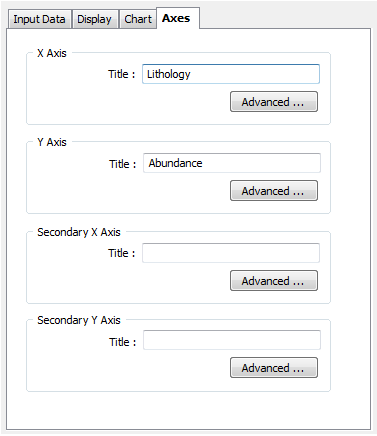
X Axis
Title
The text you enter here will appear as a title along the X axis of the chart. Click the Advanced button if you want to define a range for the axis (rather than show the full range of the data).
Y Axis
Title
The text you enter here will appear as a title along the Y axis of the chart. Click the Advanced button if you want to define a range for the axis (rather than show the full range of the data).
Secondary X Axis
Title
If a Secondary X axis is supported for this type of chart, the text you enter here will appear as a title along the axis. Click the Advanced button if you want to define a range for the axis (rather than show the full range of the data).
Secondary Y Axis
Title
If a Secondary Y axis is supported for this type of chart, the text you enter here will appear as a title along the axis. Click the Advanced button if you want to define a range for the axis (rather than show the full range of the data).