Data Annotations
Use the Data Annotations grid to add point and line annotations and labels to the data on the chart.
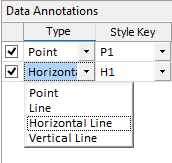
Select an annotation type from the drop-down list. You can use the buttons on the grid list toolbar (or use the right-click menu) to Manage the rows in the list.
Each annotation has a style key that can be mapped to a style in the Data Annotation Styles grid.
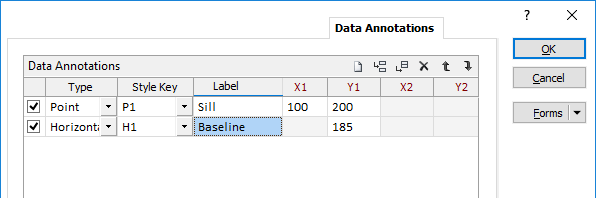
Labels are optional. If the Label cell is left blank, no label will be added for that annotation.
Data Annotation Styles
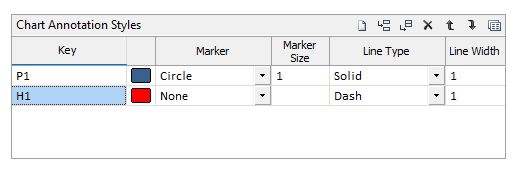
Use the Data Annotation Styles grid to associate styles with the annotations you have defined for the data in the chart. Each style in the grid has a style key that can be mapped to an annotation in the Chart Annotations grid.
You can use the buttons on the grid list toolbar (or use the right-click menu) to Manage the rows in the list.
- Enter a style key name that indicates the type of annotation it should be applied to.
- Click on the icon to select a display colour.
- To set a point style, choose a marker symbol and specify a marker size.
- To set a line style, choose a line type and specify a line width.
- To set a generic style for both points and lines, follow steps 3 and 4.

|
Click the Forms button on the grid toolbar to save the styles you have defined as a form set. This allows styles to be easily shared between charts. |
Interactively annotate the chart
The Data Annotations tab allows you to edit existing annotations. Initially, it is easier to create and position annotations interactively, while the chart is open, using annotation tools on the Chart toolbar.
You can open and minimise the Chart form while you add annotations interactively.
- Click OK in the Chart form to generate the chart.
- Select one of the following Annotation tools on the Chart toolbar:
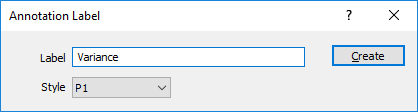
- (Optional) In the Annotation Label dialog, enter a label for the annotation you have added.
- (Optional) If styles have already been defined on the Data Annotations tab of the Chart form, apply a style to the annotation.
- Open the Chart form. You can then:
- Delete unwanted annotations (note that you cannot delete them interactively);
- Adjust the position of the annotations you have added interactively;
- Add new styles, edit existing styles, and associate styles with annotations;
- Click Apply to preview your changes without closing the Chart form.
|
|
Click the Point annotation tool and use the mouse to digitise a point on the chart. |
|
|
Click the Line annotation tool and use the mouse to digitise two points to set the size and position of a line on the chart. |
|
|
Click the Horizontal Line annotation tool and use the mouse to digitise a point to set the position of a horizontal line on the chart. |
|
|
Click the Vertical Line annotation tool and use the mouse to digitise a point to set the position of a vertical line on the chart. |
|
|
Click the Clear Annotations button to clear the annotations added to the chart. |
|
|
Click the Move Annotations button to move selected annotations. |