Display a legend
The Legend buttons on the Display Pane toolbar allow you to view (but not edit) the colour sets, hatch sets, line sets, and symbol sets that are applied to your display layers.
These buttons are only enabled when the layer selected in the Display Pane has an associated colour set, hatch set, line set, or symbol set.
To display a legend, click the Legend button on the Display Pane toolbar:
![]()
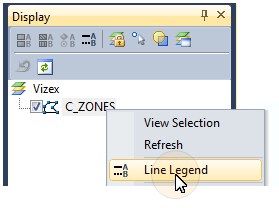
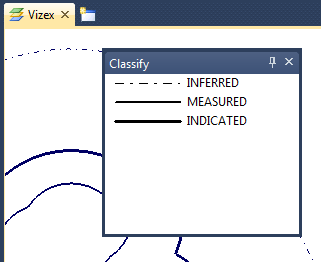
Alternatively, right-click on the display object and select a Legend option from the right-click menu. In the following example, the C_ZONES layer has an associated Line set:
Modify a Legend
You cannot directly modify the displayed legend. Instead, you need to modify the colour set, hatch set, line set, or symbol set the legend is based on.
A displayed legend is updated automatically whenever the underlying colour/hatch/line/symbol form set is edited. When the Refresh All button is clicked, all displayed legends are refreshed.

Plot a legend
You cannot directly plot the displayed legend. To include a legend in a plot, your plot must contain a legend frame that is based on the same colour, hatch, line, or symbol set.