Search Neighbourhood
The Stats | Search Neighbourhood function provides a visual indication of which points lie within a neighbourhood. Summary statistics and a histogram of the grades of those points is also provided.
The function can be run as a precursor to the QKNA function, or any function that requires the input of a search neighbourhood.
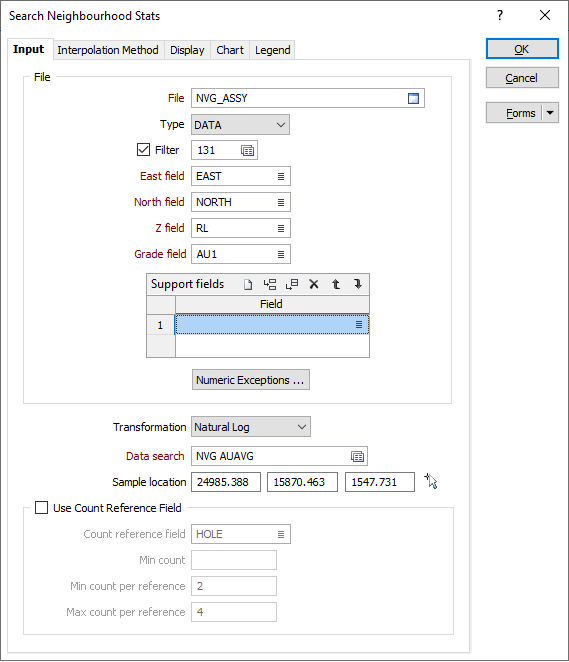
Input
Select a file type and then double-click, or click on the Select icon, to select the file containing the grades you want to generate top cut values for.
East, North, Z fields
Double-click (or click on the List icon) to select the fields containing the coordinates of the data points you want to calculate and plot.
Grade field
Double-click (or click on the List icon) to select the field containing the grade values you want to calculate and plot.
Support fields
To support multivariate data for Co-kriging, specify one or more fields. These fields will be shown in the chart
Note that default labels in charts often use the input field name to label the data being plotted. If these fields are expressions, then the expressions will be used as the label text. To avoid this, you can use an additional attribute to define the label. See: Output field name attributes in Chart labels
Numeric Exceptions
(Optional) Use the Numeric Exceptions group to control the way that non-numeric values are handled. Non-numeric values include characters, blanks, and values preceded by a less than sign (<).
Transformation
Select the method that will be used to process the data before it is used by the function:
- NONE – For normally distributed data. Uses the raw data values. This is the default.
- NATURAL LOG – For log-normally distributed or positively skewed data (such as precious metal assays).
Data search
Double-click in the Data Search input box to load a form set. Alternatively, right-click to open a form where you can define the shape and direction of the search ellipsoid. See: Ellipsoid Parameters
Sample location / Block centroid
This prompt will according to which POINTS or BLOCKS interpolation mode is chosen on the Interpolation Method tab of the form.
It may be useful to pick a point in Vizex as the sample location or centroid of the search ellipsoid. To collapse the form, click the Pick Point icon to the right of the coordinate inputs:
![]()
The coordinates of the point you have picked are loaded into the form.
Use Count Reference field
Select this option to select a field from the sample or composite file (i.e. Hole_ID) which will be used as a reference counter. Double-click or click on the List icon to select the field.
Min Count field
Optionally, use the Min Count field to specify a minimum number of values to be applied to the calculation for each block.
Min & Max count per reference
In effect, the Min count per reference and Max count per reference values allow you to apply a filter condition. For example, you may want to ensure that, for every hole, you only count a certain number of "best" points.
- Min count per reference is useful when you want to specify that you only want holes that have a certain minimum representation in a search neighbourhood (so that points are not counted, for example, when a hole has only one point in its search neighbourhood).
- Max count per reference is useful when you want to specify that all the points found in a search neighbourhood should not come from a single hole.
Both parameters use the Count Reference field to constrain the points that are selected by the grade interpolation process.
FOR EXAMPLE:
If Min count per reference = 2, Max count per reference = 6, Maximum points per sector = 8, and the "Count reference field" = HOLE_ID, then, for each search neighbourhood we want to find points to base our calculations on:
The process will look at that search neighbourhood and only count points from holes where at least 2 points are present, only take the 6 "best points", and take a total of 8 points per sector (those 8 can be from any holes).
Forms
Click the Forms button to select and open a saved form set, or if a form set has been loaded, save the current form set.
By design the Forms button is not available for loaded Vizex layers (i.e. when opening the form set properties of a layer in the Display Pane). In Vizex, the Forms button is only available for new forms opened via the Display | Vizex menu (or by double-clicking on a form type node in the Vizex Forms Pane).
Save and Save As
Click the Save button to save the changes you have made to the form set. Click Save As to save your changes as a new form set. Save As will default to the first available form set number.
Reset
Click Clear to clear the form of all values and reset the form to its default state. In the case of tabbed forms, set the first tab as the active tab.
Undo and Redo
Click Undo (CTRL + Z) to undo recent changes in the form. After an Undo, click Redo (CTRL + Y) to restore the last change that was undone.
Collapse
Collapse (roll-up) the form to preview a chart, or preview the results of an operation in Vizex, or obtain input values from Vizex, the Property Window, the File Editor, or the Plot Editor.