Using the Variogram Map
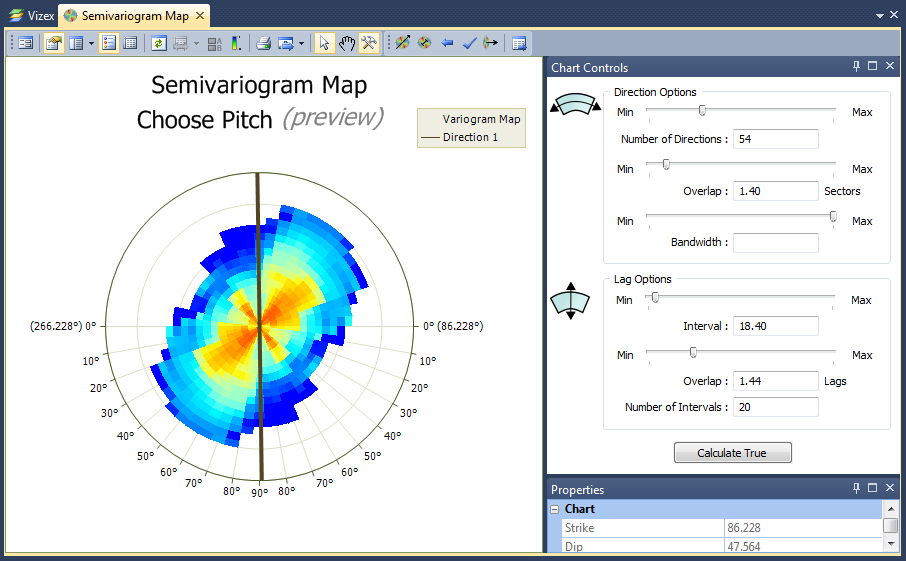
Use the Stats | Semi Variogram Map function to display semi-variance in a traditional polar (circular) display. The map plane may be positioned in any 3D orientation. Display parameters (such as lag intervals, number of directions and overlaps) are dynamically adjusted using slider bars, with near-instant updates.
Interactive tools are provided for picking directions. Three directions are necessary for a full 3D orientation and Micromine guides you through the process of defining the strike and dip of the orebody plane, along with the pitch of the main axis falling within it. These orientations are then written to a Variogram Control File that is used elsewhere in Micromine.
Variogram map with original assays and interpreted wireframe. Both views are live and fully interactive.
Background
Many mineral deposits exhibit a clear directional trend in their mineralisation, with grades that continue for a longer distance in one direction compared to others. For example, grades in a structurally-hosted quartz vein are much more continuous along strike than across the thickness of that vein. Such a deposit is said to be anisotropic because its grade continuity varies with direction.
The semi variogram map (or just variogram map) is an exploratory chart for detecting anisotropy and finding the direction in which grades are the most continuous. It works by defining bins (called sectors) that represent unique distances and directions, gathering together all possible sample pairs that fall within each sector (i.e. separated by that distance and direction), and then calculating and displaying their semi-variance. Tolerances are used to accommodate sparse or irregularly distributed data.
Because the map uses distance and direction to define the sectors it is arranged in a radar-style circular plot that is always centred at zero. The centre of the map represents zero separation, and the distance and direction of each sector from the centre indicates the separation between the pairs used to calculate that sector. Because semi-variance is a squared number the variogram map always displays two-fold rotational symmetry (one half is a 180° rotation of the other).
Defining continuity
Defining continuity on a variogram map relies on a simple principle: comparing the values of two samples separated by a known distance and direction:
Suppose you are working on a mineral deposit comprising a north-striking structurally-hosted vein. Imagine collecting two samples separated by a short distance in a north-south direction, and another two samples separated by the same distance in an east-west direction.
If the difference in grade between the two N-S samples is 1 ppm and between the two E-W samples is 5 ppm, you could say the grade changes less in a N-S direction than it does in an E-W direction. Changing less is just another way of saying more continuous.
Now imagine averaging the differences between all possible sample pairs separated by that same short distance. This is the basis of what appears in each sector.
You can use this property (less variation between adjacent or nearby grades when continuity is strong) to understand the information in the variogram map: the direction in which the grades are most continuous is typically shown on the map by an elongated zone of low values. (Here low values mean less variation between sample pairs, not lower grades.) In a two-dimensional setting (such as a coal seam) two directions are defined: the direction of maximum continuity (the main direction), and the direction of least continuity (the second direction) at right-angles to it.
The zone of low values defined by the two directions is roughly the shape of an ellipse centred on the centre of the map. The long axis represents the main direction. By measuring the radii of the two directions (from a recognisable contour) you can then calculate the ratio of the radii, revealing the ellipse’s anisotropy ratio. A strongly anisotropic deposit typically has a higher anisotropy ratio than a weakly anisotropic one.
The ellipse becomes an ellipsoid in a three-dimensional setting, requiring three angles and three axes to define it. However, the basic principles are the same.