Display a multi band
image
The Multi Band Images button is enabled whenever a multi band file has been selected. Although this method is most applicable to images it may also be used on grids if necessary. Depending on how the input file was created, you may need to define a number of display characteristics.
Many image and grid formats support multiple bands. Some common examples are TIF, JP2, and ECW.
Spectral bands
Image data is frequently collected from several spectral bands. These may include the visible part of the spectrum such as red, green and blue; the infra-red part of the spectrum; or elsewhere. For example, the Landsat™ satellites collect data from seven spectral bands: red, green and blue in the visible range, three bands in the near IR portion of the spectrum, and one thermal IR band.
Images are displayed on your computer by combining three display colours (red, green, and blue). You must allocate the desired spectral bands to these colours in order to construct a colour display of a multi band image. You do so by matching an image band number to each display colour.
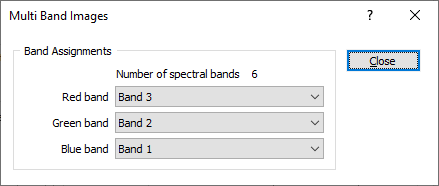
The Multi Band Images dialog lists the total number of spectral bands in the file. Each band is numbered in the same order as stored in the file, and given names such as “Band 1” are displayed where available. When allocating band numbers to display colours you should keep in mind that the order in which the bands are stored may not correspond to their named order. For example, Band 7 of a Landsat scene is usually the sixth band in a file prepared for geological mapping.
Note that when you are loading images through the Display | Image form, the band assignments are whatever are currently in the Multi Band Images sub-dialog. So if you have an image showing as greyscale because Red, Green and Blue are all assigned the same band, a newly loaded image will inherit those band assignments, unless you manually change them, or the form is reset (which sets the assignments back to 3-2-1).