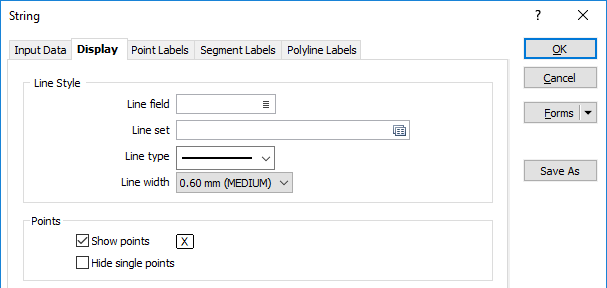
Display
Use the parameters on the Display tab to set display options for strings, markers along strings, and polygons (closed strings).
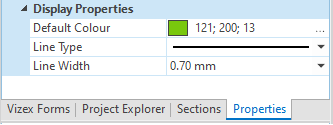
Note that some display properties may be viewed and edited in the Vizex Property Window:
Line Style
Line sets give you the ability to apply different line styles and line widths to the polylines in a single dataset. You can apply them in the same way that you can apply colours, hatches and symbols to your data.
Line field
Double-click (F3) to select the name of a field that will be matched to the code values in a Line set.
Line set
If you have specified a Line field, double click (F3) to select the set that will be used to control the style and the width of the polylines in the dataset.
Line type
Select a line type. A preview of each line type is shown in the drop-down list. A variety of solid, dotted, and dashed line styles are available for selection.
Line width
Select a (THIN, MEDIUM, THICK, or custom) line width from the drop-down list. An extensive selection of custom widths (in millimetres) are available for selection.
Points
Show points
Select this option if you want the points along a string to be visible. Optionally double-click the Colour icon to select a display colour for the string points.
Hide single points
Select this option if you want to hide single points in the display and exclude them from any plots generated from the display.
The Show Points option only affects the points along a string and has no effect on single points.
Line Markers
Show Line Markers
Select this option to draw symbols at specified points along lines. Double-click on the icons to select a symbol and a colour for the markers.
Align markers
Select this option to align the markers so that they match the orientation of the line.
Gap at marker
Select this option to show a gap in the line at the position of each marker.
Offset
Select this option to offset the markers rather than position them on the line. Specify an offset value in grid units.
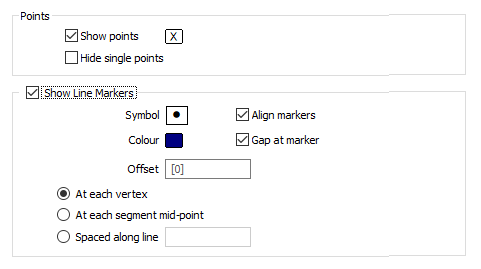
You can choose to position the markers:
- at each vertex
- at each segment mid-point
- spaced along the line at a specified distance
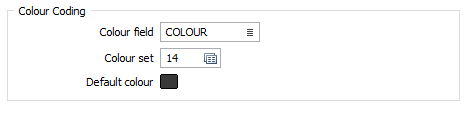
Colour Coding
Colour field
Specify the name of a field which contains the values that will be used to colour-code the display. If you are mapping Colour field values to a Colour Set, the values in the Colour field must be valid RGB, HTML Hex, Hex, or Integer colour definitions.
| Format | Example | |
|---|---|---|
| RGB | 89,169,215 | RGB ordered |
| HTML Hex | #59A9D7 | BGR ordered |
| Hex | 0x59a9d7 | BGR ordered |
| Int | 5876183 | BGR ordered: RED + (GREEN*256) + (BLUE*65536) |
You can choose to select colour values directly from the Colour field without selecting a Colour set. In this case, you can also select a formatted Colour field.
You can view and edit the RGB values assigned to the Colour field in the Property Window. Click on the ellipsis to open the Colour picker:
Colour set
Specify the name of a field which contains the values that will be used with a Colour set to colour-code the display.
Default colour
Double-click (F3) to select the colour that will be used when a Colour field or a Colour set is not defined - or when a value in the Colour field is either not valid or is not mapped in the Colour set.
Fill Polygons
Select this option if you want to apply a hatching or transparency to the closed polygons in the display.
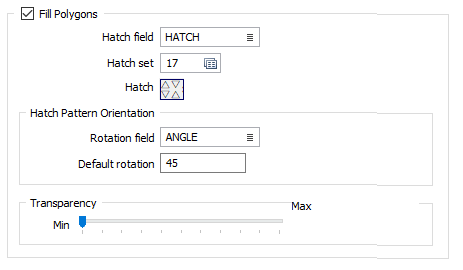
Hatch field
Double click (F3) or click on the List icon to select the name of a field containing the data that will control the hatching. The hatch set associated with this field maps hatch patterns to text strings or numeric ranges. For each record in the file, the hatch pattern to be used is determined by the value in this field.
Hatch set
Double click (F3) to select the set that will be used to control the hatch pattern. The hatch set maps hatch patterns to text strings or numeric ranges. This determines the hatch pattern for each value in the Hatch field. Right click (F4) to create or edit a hatch set.
Hatch
Double click (F3) to select the hatch that will be used when a hatch set is not defined, or when the value in the hatch field is not mapped in the hatch set.
Hatch Pattern Orientation
Double click (F3) or click on the List icon to select the name of a Rotation field containing rotation values (clockwise, in degrees) that will be used to rotate the hatch pattern.
Default rotation
You can also define a default rotation for the hatch. This will be used when a Rotation field is not defined, or when rotation values in the Rotation field are missing or invalid.
Transparency
Use the transparency slider to specify the intensity of the polygons. The visibility of the layers underneath the polygons will be determined by the degree of transparency you select.