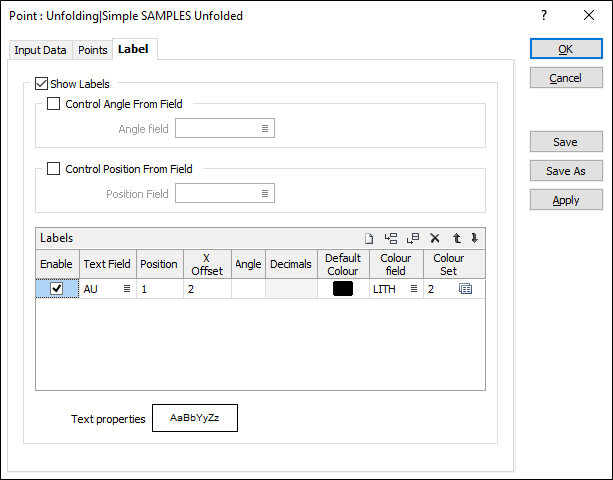
Label
Use the Label tab of the Point form to define the appearance and position of the text that will be used to annotate the points. You can show up to ten labels for each point, controlled by the text values in different fields. A single field can be used to control the angle of all labels, or you can specify an angle value for each label. Colour fields and defaults can be specified for each label.
A typical use would be for the display of geochemical plots with values from several different data fields around each point.
Show Labels
Select this option if you want to label the points in the display. Specify the fields and values that will be used. The display of the labels can be quickly toggled on and off using the Label check boxes to the left of each Label field. The check boxes are turned ON by default.
Control Angle From Field/ Angle field
Select this option to apply the values contained in a specified Angle field. When this option is selected, the Angle inputs in the Label Definition pane (see below) are disabled.
Control Position From Field/ Position field
Select this option to apply the values contained in a specified Position field. When this option is selected, the Position inputs in the Label Definition pane (see below) are disabled.
Labels
Select the Enable check box to enable individual labels. Use the buttons on the grid list toolbar to Manage the rows in the list.
Text field
Specify the names of the fields containing point annotation values. If you leave the Text fields empty, only the points are displayed.
Position
The position of the point annotation. Annotation can be located at one of fifteen positions on or around the coordinate point. Double-click (or press F3) to open the dialog box from where you can select a suitable position. See: Position your display labels (multiple data values)
X offset
To offset the label text from the points, specify an X offset value.
X offset units are "Character" widths not grid units.
Angle
If you have not specified an Angle field, specify the angle (0° to 360°) at which the annotated text will be drawn. The following diagram shows some examples.
An angle of 0° results in vertical (up) text. An angle of 90° results in horizontal (to the right) text, etc.
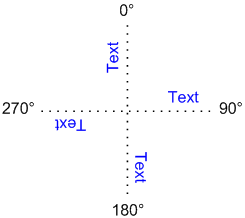
Leaving the Angle field and Angle responses blank will produce horizontal text. There is no need to explicitly specify an angle of 90°.
Default colour
Double-click (F3) to select the colour that will be used when a Colour field or a Colour set is not defined - or when a value in the Colour field is either not valid or is not mapped in the Colour set.
Colour field
Specify the name of a field which contains the values that will be used to colour-code the display. If you are mapping Colour field values to a Colour Set, the values in the Colour field must be valid RGB, HTML Hex, Hex, or Integer colour definitions.
| Format | Example | |
|---|---|---|
| RGB | 89,169,215 | RGB ordered |
| HTML Hex | #59A9D7 | BGR ordered |
| Hex | 0x59a9d7 | BGR ordered |
| Int | 5876183 | BGR ordered: RED + (GREEN*256) + (BLUE*65536) |
You can choose to select colour values directly from the Colour field without selecting a Colour set. In this case, you can also select a formatted Colour field.
Colour set
To map values in the Colour field to the colour values in a Colour set, double click (F3) to select the set that will be used to control the display colour. Right-click (F4) to create or edit a Colour set.
Text Properties
Double-click on the Text Properties Preview box to select a font and set text properties for the labels.