Opening a drillhole correlation diagram
Although it is possible to configure correlation diagrams to be opened from the Geobank tree using the standard Open method, this approach has several limitations, mostly due to the fact that drillholes are simply displayed in the order that they appear in the dataset.
This means that the drillholes may not appear in the desired order when displayed on the section, unless the correct sort order is established via the SQL statement used to retrieve the collar data. However, when the diagram is opened via a plan view, drillholes are always displayed in the order that they were selected on the plan. It is therefore easier to generate a meaningful correlation diagram from the plan view.
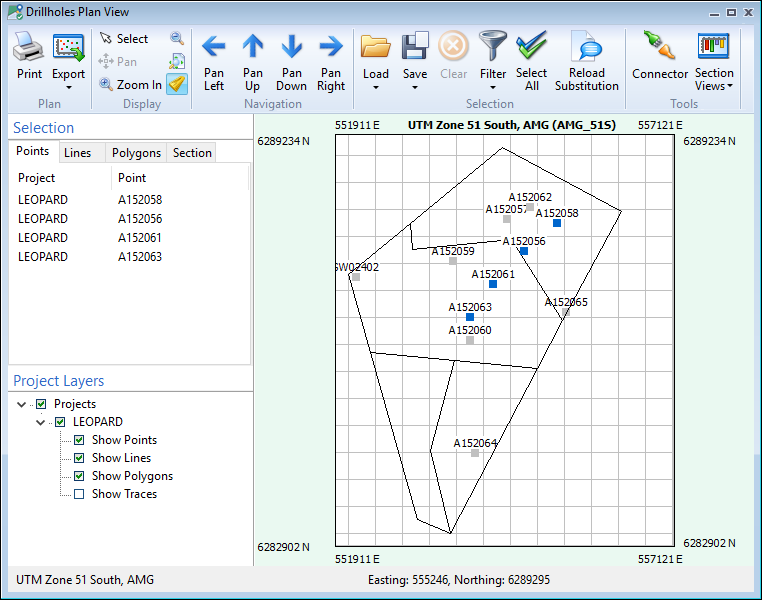
Using correlation diagrams from the Plan View
Use the Select tool to manually select drillholes for use in the correlation diagram. Use the CTRL key or the SHIFT key with the mouse to select multiple holes. Click on the drillholes in the order that they should be displayed on the section.
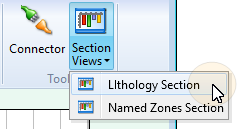
To choose from a list of pre-configured sections and correlation diagrams (as retrieved from the Drillholes node of the object tree) select an option from the drop-down Section menu.
Note: The Section View drop-down will list all configured correlation diagrams, not just those assigned to the current profile.
.
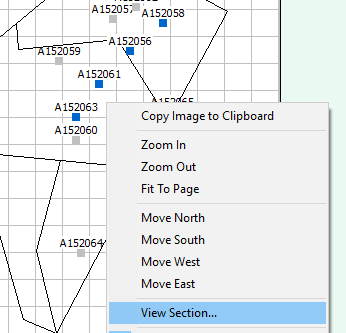
Alternatively, after selecting the final hole, right-click on the view and select View Section.
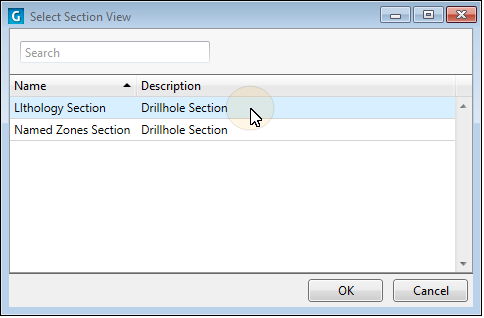
You will be prompted to select a pre-configured section view:
The drillholes will be displayed on the Section View page:
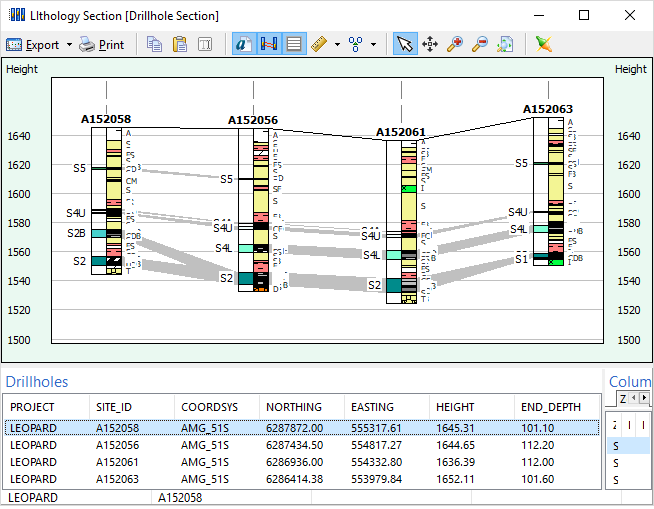
The currently selected hole and interval are highlighted in the Drillholes and Column Data panels.
- You can use the "Zoom" tool to view a specific height interval in more detail. Alternatively, resize the window to adjust the scale of the display.
- Click the "Zoom Out" button to redraw the complete section.
- Choose Edit | Copy to copy the image to the Windows clipboard.
- Use the Refresh option to redraw the image.
You can enhance the appearance and functionality of the diagram by including the secondary annotation column and annotation colour constants in your downhole data.
Join lines between zones can be displayed by selecting the Enable automatic drawing of correlation lines based on the zone hierarchy option as part of the properties of the diagram.
For more information refer to the Configuring a Correlation Diagram topic.