Plan View
Plan views are configured under the Drillhole Utilities | Plan Views node of the Configuration Manager. Once they are configured, they can be added to a profile.
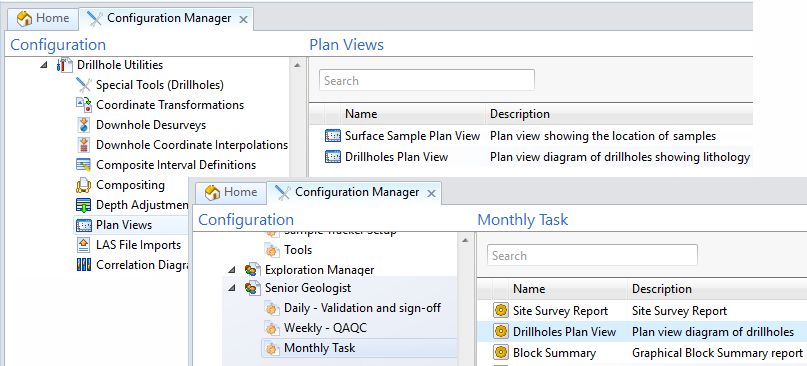
To execute a plan view, right-click on the plan view object and select Execute from the right-click menu.
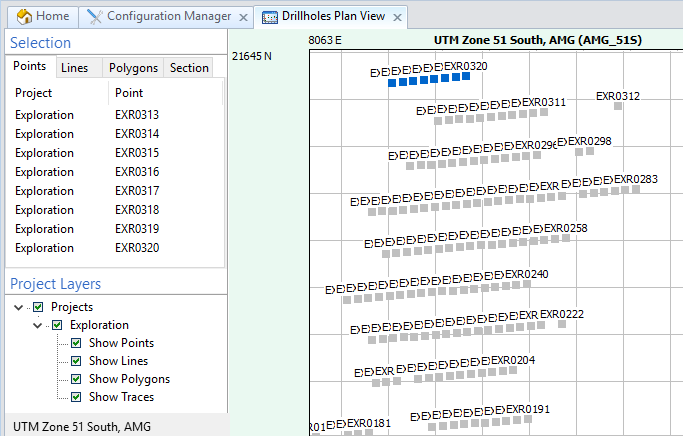
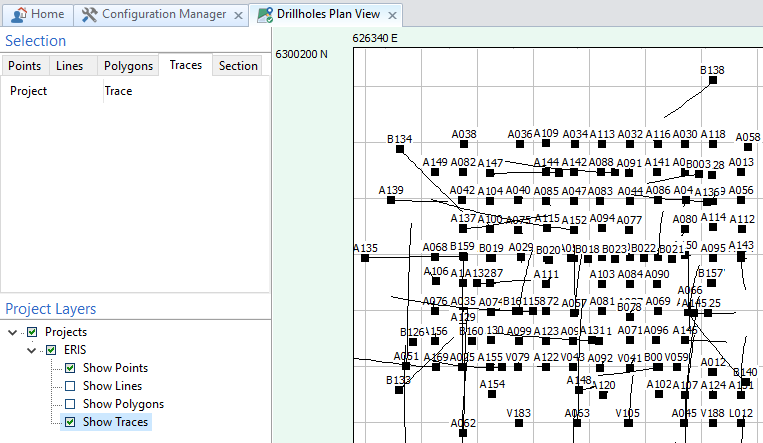
The Plan View provides a visual representation of the point, boundary, and section data for a project, or across multiple projects. If the data from more than one project is retrieved, the first project you select determines the coordinate system that will be used for the display.
Point and boundary data is automatically converted to a common, nominated coordinate system prior to viewing. Pit outlines surveyed on a local grid, for example, can be quickly and easily displayed alongside drillholes surveyed in UTM.
The Plan View can be used in three ways:
- As a validation tool. By viewing your data spatially, anomalies in your data, such as incorrectly entered coordinates, are more easily identified.
- As a connectivity tool. Provided that Find parameters have been set up for a graphic report, the plan view can be used to spatially select a hole, a line, or a polygon boundary that will be queried in a graphic report.
- As a select tool.The plan view includes an in-built Site List Editor. The Plan View can be used to spatially select the holes that will be included or excluded from a site list
Point, line, and polygon layers can be manipulated in the Plan View:
Points
Left-click on a point to select it. Hold down the SHIFT key to multi-select. You can also click and drag the mouse to select the points within a selection rectangle, or select the points within a boundary on the Polygons tab (see below).
Lines
Left-click on a line to select it. Hold down the SHIFT key to multi-select.
Polygons
For polygons, left-click within a boundary to select it. Hold down the SHIFT key to multi-select.
Use ALT to toggle the state of all points within a boundary.
Use CTRL to deal with overlapping or obscured boundaries.

Traces
Left-click on a drillhole trace to select it. Hold down the SHIFT key to multi-select.
Section
To view a section:
- Click on the Section tab.
- Select the successive drillholes that you want
to display in section, Alternatively, click on the Load selection from... button
 to load a previously saved site list.
- Select an option from the Section Column tool menu. When you select one or more columns, those columns are displayed in the Section View.
Multiple columns can be configured per section view on the Configuration | Sections page of the Plan View Property Editor.
The following tools are provided on the Plan View toolbar:
|
|
Click the Print button to print the current view. |
|
|
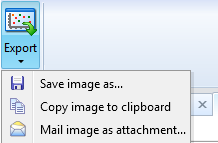
Select an option from the Export tool menu. You can save the current view as an image, copy the image to the clipboard, mail the image as an attachment in an email, or save the image in a format that can be viewed in Google Earth |
|
|
|
|
|
When you use the Select tool
to click on a drillhole, the coordinates for that point are shown in the
status bar. When you click on a boundary, the extent of the boundary are
displayed. To select a polygon that is obscured by another boundary: Use Ctrl + Click to drill down to the next level. As you move the cursor around the display with the mouse, the coordinates of the cursor position are constantly updated and shown in the status bar. |
|
|
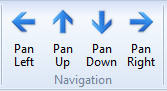
Click the Pan tool to put the view into Pan mode. When the view is in Pan mode you can pan the view left and right, or up and down, by clicking and dragging the mouse. Alternatively, click on the Pan tools to move incrementally left,right, up or down. |
|
|
|
|
|
Click the Zoom in button to zoom in on the current view. |
|
|
Click the Zoom out button to zoom out on the current view. |
|
|
Click the Fit To Screen button to fit the entire length of the drillholes in the section view. This action will automatically turn off annotation to avoid clutter. (See "Annotation button" above). |
|
|
Click the Show Grid button to toggle the grid on and off. |
|
|
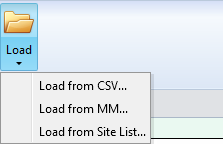
Select an option from the Load menu to load data in CSV or Micromine format, or from a Site List. |
|
|
|
|
|
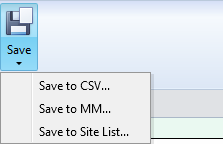
Select an option from the Save menu to save the data in the view to CSV or Micromine format, or save it to a Site List. |
|
|
|
|
|
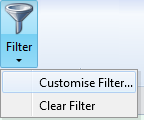
Use the Filter menu to create a Custom Filter. Select Clear Filter to clear a filter that has previously been applied to the dataset. See: Filter Editor |
|
|
|
|
|
Click Select All to quickly select all of the holes in the plan view. |
|
|
Click Clear to clear the current selection. |
|
|
Click the Connectivity tool to spatially select a hole or a boundary that will then be queried (typically to create a downhole or a lease summary graphic report. |
|
|
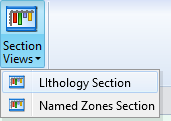
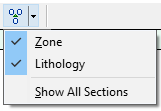
Use the Section Views tool menu to select a section to display. The sections available for selection are configured in the Configuration | Sections page of the Plan View Property Editor. See: Drillhole Section |
|
|
|
|
|
Note: The Section View drop-down will list all configured correlation diagrams, not just those assigned to the current profile. |