Chart
On the Chart tab you can set options to add a title and a subtitle to the chart, apply a theme to the chart, show a legend, and show properties on the chart.
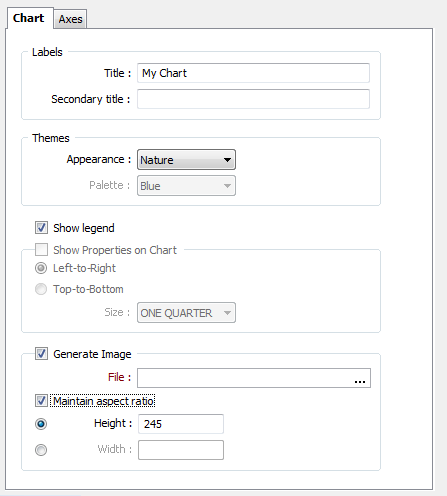
Labels
Title
The text you enter here will appear as a title on the chart.
Secondary Title
The text you enter here will appear as a subtitle on the chart.
Tip: You can use XAML markup language to apply formatting to your titles and subtitles For more information, refer to the: Chart Formatting and Mark-up Reference
Themes
You can quickly set the appearance (background colour, borders, axis lines) of the chart by applying a theme and a palette.
Show Legend
Select this option to display a legend on the information pane of the chart.
Show Palette
Select this option to use the colour range defined in a palette to colour code the chart, rather than select individual colours for each chart element.
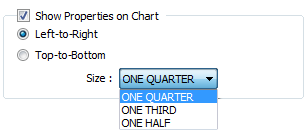
Show Properties on Chart
If properties are supported for the type of chart being created, select this option to show properties on the chart itself. Options that determine the position and the width of the Properties pane are provided.
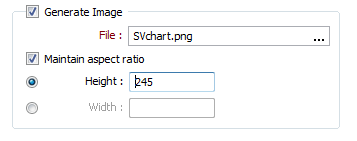
Generate Image
Select this option to generate an image of the Chart display.
File
Double-click (or click on the Select icon) to select the name of the output image file. Rather than specify a file extension, you can click on the ellipsis button and select from a list of supported image file formats.
Maintain aspect ratio
When this option is selected, the Y Scale is recalculated from the X Scale and the current aspect ratio when the Width or the Height of the image (in pixels) is resized.
Note: These options are also available on the Chart toolbar when a chart is opened in Vizex. See: Create Sized Image