Modelling Process
In a three-dimensional setting, determining the directions of continuity is a three-step process:
- Create a horizontal variogram map:
- Use Select Direction to measure the direction of greatest continuity, which defines the strike of the plane containing it.
- Click Next to advance to the next map.
- Create a vertical variogram map at 90° to strike:
- Use Select Direction to measure the direction of greatest continuity, which defines the dip of the plane containing it.
- Click Next to advance to the next map.
- Create an inclined variogram map in the strike/dip plane:
- Use Select Direction to measure the direction of greatest continuity, which defines the pitch (rake) of the main direction falling within the plane defined by the strike and dip.
- Click Next to apply the third orientation.
- Click Create Variogram Control File to generate an axis summary to be used as input in the semi-variogram (Stats | Semi Variograms) and search ellipsoid (via Vizex > Search Ellipsoid) dialogs.
If necessary you can click Previous to return to an earlier map. Only the horizontal variogram map is required in a two-dimensional setting.
Interactive sliders in the Chart Controls pane may be used at each step in the modelling process to adjust and refine the map parameters, with an instant preview of the result. Clicking Calculate True will recalculate the true map using the new parameters, which may cause a small change in appearance.
Micromine displays reference tics around the perimeter of the map to help keep it in context:
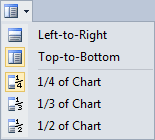
- In the horizontal map they show azimuth
- In the dip map they show dip; the forward and reverse dip directions are also shown
- In the inclined map they show pitch; the forward and reverse strikes are also shown
For reference the status bar always displays the azimuth and plunge of the mouse pointer’s position.
Right-clicking an existing variogram control file (via Create Variogram Control File) will display a full report showing the calculated orientation in all possible conventions (rotations, azimuth/plunge, and strike/dip/pitch).
Chart toolbar
The options on the left-hand side of the toolbar are applicable to most charts:
| Button | Description |
|---|---|

|
Click the Form button to open the form associated with the generated chart. |

|
Click the Properties button to view the properties of the chart in a Property Window. |

|
If properties are supported for the type of chart being created, click the Chart Properties button to show properties on the chart itself. Options that determine the position and the width of the Properties pane are provided. |
|
|

|
Click the Show Legend button to display a legend on the chart. |

|
Select the Show File button to open the input file alongside the chart. You can use the Sync Selection options on the Chart toolbar to synchronise data selections in Vizex or the File Editor. See "Sync" below. |

|
Click the Refresh button to refresh the chart. This may be necessary when changes have been made to the underlying data. |

|
If a colour set has been applied to the chart, click the Colour Set button to show the colour sets in a legend. |

|
If a palette has been applied to the chart, click the Show Palette button to toggle the display of the palette on and off. |

|
Click the Print button to send an image of the chart to a printer. The chart will be re-scaled so that a best-fit of the page is achieved, while still maintaining the aspect ratio. |

|
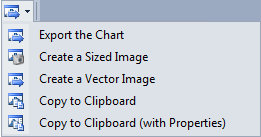
Click the Export button to Export the Chart: |
|
|

|
Click the Select tool to interact with some types of chart. |

|
Click the Pan/Zoom tool and then scroll the mouse to zoom, or click and drag the mouse to pan. |

|
Click the Point Annotation tool to use the mouse to digitise a point on the chart. |

|
Click the Line Annotation tool to use the mouse to digitise two points to set the position, length, and orientation of a line on the chart. |

|
Click the Horizontal Line Annotation tool to use the mouse to digitise a point to set the position of a horizontal line on the chart. For more information about, see: Data Annotations |

|
Click the Vertical Line Annotation tool to use the mouse to digitise a point to set the position of a vertical line on the chart. |
|
|
Click the Clear Annotations button to clear the annotations added to the chart. |

|
Click the Move Annotations button to move selected annotations. |

|
Click this button to Show/hide |

|
Click the Help button to view an online help topic for this function. |
Other tools on the Chart toolbar are specific to the type of chart displayed. In the Semi Variogram Map display:
| Button | Description |
|---|---|

|
Click the Toggle Snapping button to enable or disable direction snapping. When snapping is turned on, the Select Direction tool and the Add Direction right-click menu option will snap to the direction at the centre of the current sector. |

|
Click the Select Direction button to pick one or more directions. |

|
You can use the Measure Distance tool to determine the anisotropy ratio (the ratio of the semi-major and semi-minor axes) by measuring their radii. |

|
Step to the Previous View (Left key) to choose a direction (Up or Down key). |

|
Step to the Next View (Right key) to choose a direction (Up or Down key). |
| When you have applied the third orientation, click the Next button to apply the directions to the bottom half of the main form. | |

|
The Next button will only appear as a tick when all necessary directions have been measured. |

|
Click the Align Vizex View button to orient the Vizex screen plane so it is parallel to the current map. |

|
Click the Toggle Preview button to show or hide a preview variogram graph alongside the variogram map. See: Preview Selected Direction |

|
Click the Create Variogram Control File button to save you settings to a file. One direction must be defined for 2D, and three directions must be defined for 3D. |
|
To view the contents of the file, click the Create Variogram Control File button and right-click in the Variogram control file response. |