Viewing the chart
The Chart window comprises two parts: the graphs you have included in the chart and the properties window:
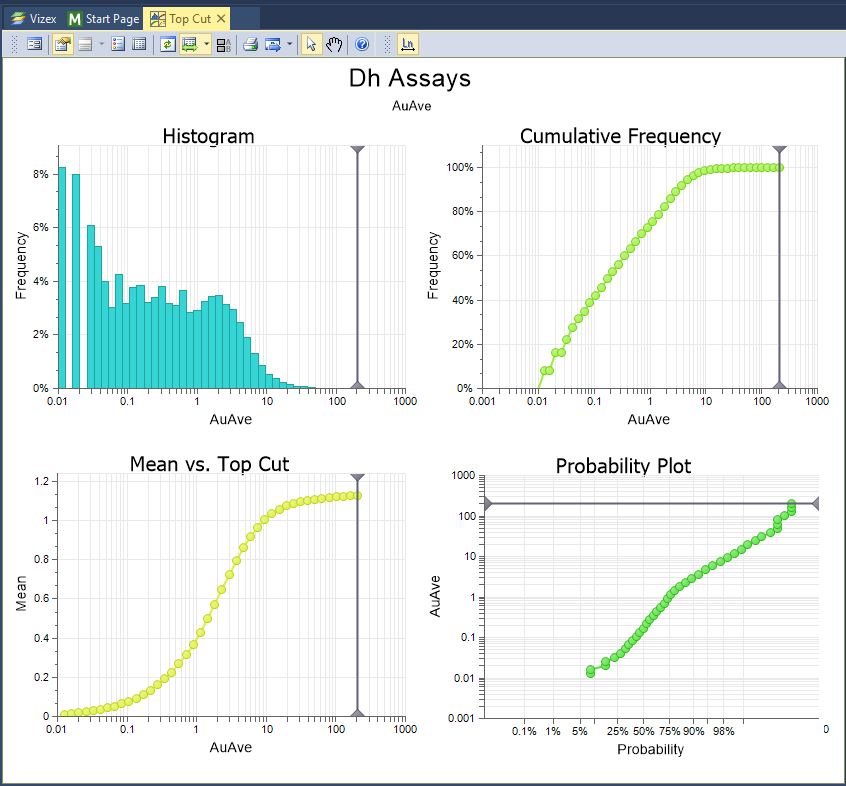
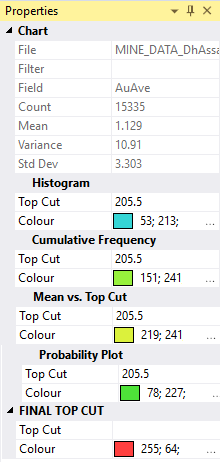
Per graph statistics and a Final Top Cut (if any) are shown in the Properties pane:
Redisplay the Chart form
To redisplay the Chart form:
- Click the Form button at left of the Chart toolbar

- Alternatively, double-click on the chart's name in the Display Pane
Interact with the chart
Zooming and panning within a chart relies on the middle mouse wheel button:
- To zoom in or out: roll the mouse wheel towards or away from you
- To zoom the X-axis only: roll the mouse wheel whist holding the Ctrl key
- To zoom the Y-axis only: roll the mouse whilst holding the Shift key
- To pan the chart (when zoomed in): drag with the middle mouse button
History
When you right-click in a chart, a context menu lets you choose from a History of recently-used functions.
If a tool is active (i.e. Panning), right-clicking in the Chart window will deactivate any active tools. Right-click again to view the context menu.
Chart toolbar
The options on the left-hand side of the toolbar are applicable to most charts:
| Button | Description |
|---|---|
|
|
Click the Form button to open the form associated with the generated chart. |

|
Click the Properties button to view the properties of the chart in a Property Window. |

|
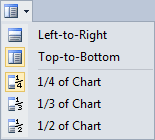
If properties are supported for the type of chart being created, click the Chart Properties button to show properties on the chart itself. Options that determine the position and the width of the Properties pane are provided. |
|
|

|
Click the Show Legend button to display a legend on the chart. |

|
Select the Show File button to open the input file alongside the chart. You can use the Sync Selection options on the Chart toolbar to synchronise data selections in Vizex or the File Editor. See "Sync" below. |

|
Click the Refresh button to refresh the chart. This may be necessary when changes have been made to the underlying data. |

|
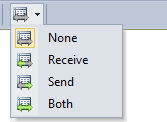
Use the options on the Sync tool menu to synchronise selections between the chart and a Vizex layer or the File Editor. See: Synchronising data selections |
|
|
| You can tile a chart with Vizex by right-clicking the tab at the top of the chart window and choosing New Vertical Tab Group from the pop-up menu. | |

|
If a colour set has been applied to the chart, click the Colour Set button to show the colour sets in a legend. |

|
If a palette has been applied to the chart, click the Show Palette button to toggle the display of the palette on and off. |

|
Click the Print button to send an image of the chart to a printer. The chart will be re-scaled so that a best-fit of the page is achieved, while still maintaining the aspect ratio. |

|
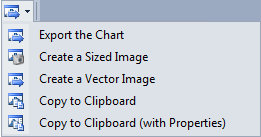
Click the Export button to Export the Chart: |
|
|

|
Click the Select tool to interact with some types of chart. |

|
Click the Pan/Zoom tool and then scroll the mouse to zoom, or click and drag the mouse to pan. |

|
Click the Point Annotation tool to use the mouse to digitise a point on the chart. |

|
Click the Line Annotation tool to use the mouse to digitise two points to set the position, length, and orientation of a line on the chart. |

|
Click the Horizontal Line Annotation tool to use the mouse to digitise a point to set the position of a horizontal line on the chart. For more information about, see: Data Annotations |

|
Click the Vertical Line Annotation tool to use the mouse to digitise a point to set the position of a vertical line on the chart. |
|
|
Click the Clear Annotations button to clear the annotations added to the chart. |

|
Click the Move Annotations button to move selected annotations. |

|
Click the Help button to view an online help topic for this function. |
Other tools on the Chart toolbar are specific to the type of chart displayed. For the Top Cut Chart, you can click a button to switch between Normal and Natural log scale:

You can also enter a Final Top Cut value in the Properties window:
Forms
Click the Forms button to select and open a saved form set, or if a form set has been loaded, save the current form set.
By design the Forms button is not available for loaded Vizex layers (i.e. when opening the form set properties of a layer in the Display Pane). In Vizex, the Forms button is only available for new forms opened via the Display | Vizex menu (or by double-clicking on a form type node in the Vizex Forms Pane).
Save and Save As
Click the Save button to save the changes you have made to the form set. Click Save As to save your changes as a new form set. Save As will default to the first available form set number.
Reset
Click Clear to clear the form of all values and reset the form to its default state. In the case of tabbed forms, set the first tab as the active tab.
Undo and Redo
Click Undo (CTRL + Z) to undo recent changes in the form. After an Undo, click Redo (CTRL + Y) to restore the last change that was undone.
Collapse
Collapse (roll-up) the form to preview the results of an operation in Vizex, or obtain input values from Vizex, the Property Window, the File Editor, or the Plot Editor.