User-defined substitutions
To define a substitution, a variable name prefixed with the @ symbol must be entered in a Data Set in one of the plot text files specified in the Text Frame form. The same variable name must also be entered in the Substitution table.
If a substitution is not found, the variable name (@variablename) is output to the plot.
You can concatenate variable names with the ‘.’ (period) character. For example, @one.@two becomes 12 when one = 1 and two = 2.
Predefined Substitution Parameters do not need to be included in the Substitutions table.
The substitutions Table
In the Substitutions table you can create your own substitutions parameters and save them as a form set. The table is used to relate the substitution variable names you define, with the actual text that you want to include in a plot layout.
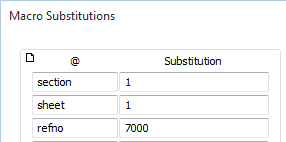
For example, you want to print a series of section plots and print the section number, sheet number and a reference number in the title:
Set up the Data Sets in the text frame once, with the text: @section, @sheet and @refno. Then refer to these in the Substitutions table and enter the actual values there:
To add entries to the substitutions table:
- In the Plot Editor, double-click in an empty portion of the layout window (or double-click on the top-most (.PEX) node in the Plot Frames pane) to open the Plot Settings form.
- Click on the Substitutions tab to view the Substitutions table.
- In the left-hand column (titled ‘@’), enter the name of a substitution variable.
- In the right-hand column (titled ‘substitution’), enter the actual text that will be substituted for the variable.