Display
Use the Display tab of the Semi Variograms form to set display colours for the parameters of the model in the chart. You can also select an option to normalise sills.
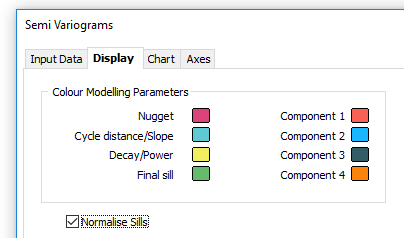
Colour Modelling Parameters
Nugget
The Nugget value (effect) is the variance at distance zero. This is always less than or equal to the sill. The nugget effect arises because the regionalized variable is erratic over a very short distance (less than the sampling interval).
Cycle distance/Slope
For a Linear model the Slope of the line is shown on the chart. For a Hole Effect or Paddington Mix model, the Cycle distance (the distance between peaks and troughs) is shown.
Decay/Power
For a General Linear model, the Power that will be used with the Slope to calculate a Range. For Hole Effect or Paddington Mix variogram models, the Decay or damping factor. This is an inverse function - the smaller the factor the faster the damping.
Final Sill
The Final Sill is the semi variogram (Y axis) value of the final or highest sill in multiple component variogram models.
Components
For some semi variogram model types, multiple components can be set, and an associated range, partial sill and model type can be entered for each component.
Normalise sills
Select this check box (or enable the Normalise Sills mode button on the Chart toolbar) to set the scale of the Y axis to show either regular or normalised sill values. Normalise Sills mode will use the variograms in the model to obtain a final sill value which is used to calculate normalised (relative to 1) sill values.
Normalise Sills mode is disabled if an experimental model with sills is not defined, or the final sill of the current model is infinite.
Show direction labels
If labels have been defined for Directional Semi Variograms or Omnidirectional Semi Variograms, use this check box to show or hide the labels.