Chart Controls
When you run the Stats | Semi Variogram Map function, you can select an option to display a Chart Controls pane alongside the chart. This allows you to set Directional and Lag options and see the effect of those settings on the semi variogram map.
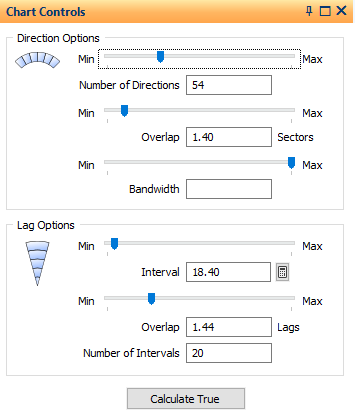
Direction Options 
Number of Directions
The number of angular increments needed to define the full 360° circle of the map. For example, setting this to 72 will produce 5° increments (360 ÷ 72).
Use the slider to set an appropriate value and see the effect on the semi variogram map. Alternatively, enter a value in the input box.
Overlap (Sectors)
Enlarges the pairing neighbourhood of the current sector by adding that number of sectors either side of it. For example, setting this to 1.5 will pair all points falling within 1.5 sectors either side of the current sector. Increase this value whenever there appears to be directional noise in the map.
Use the slider to set an appropriate value and see the effect on the semi variogram map. Alternatively, enter a value in the input box.
Bandwidth
Optionally limits the width of the search sectors. For example setting this to 10 will prevent the sector search becoming any wider than 10 grid units (metres or feet) either side of the current direction.
Use the slider to set an appropriate value and see the effect on the semi variogram map. Alternatively, enter a value in the input box. Setting the slider to Min or Max will clear the Bandwidth value.
Lag Options 
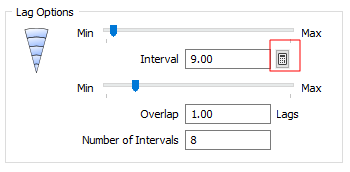
Interval
The Lag Interval is the step size used to define radial distances on the map. For example, setting this to 25 will produce sectors at radial distances in 25 (grid unit) increments. This number should be close to the average sample spacing.
Use the slider to set an appropriate value and see the effect on the semi variogram map. Alternatively, enter a value in the input box or click on the Auto Calculate button to calculate a default value.
Overlap (Lags)
Enlarges the pairing neighbourhood of the current lag by adding that number of lags in front of and behind it. For example, setting this to 2 will pair all points falling within 2 lags either side of the current lag. Increase this value when there appears to be radial noise in the map.
Use the slider to set an appropriate value and see the effect on the semi variogram map. Alternatively, enter a value in the input box.
Number of Intervals
The number of lags in the map. Together with the interval this defines the total radius of the map. For example, setting this to 15 with a lag interval of 25 will produce a map with a radius of 375 (grid units). This radius should be about one-half of the diagonal distance through the area under investigation. Reduce the number of lags if you see gaps around the outer edge.
Calculate True / Calculate Interactive
The Calculate button can be in one of two states and is set initially by the Interactive mode setting on the Semi Variogram Map of the Semi Variogram Map form.
When Interactive mode is enabled, you can adjust and refine the map parameters in the Chart Control pane and see an instant preview. This approximation (rather than true calculation) of the variogram map makes the slider controls on the pane more responsive.
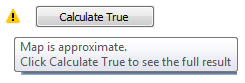
When you make an adjustment in the Chart Controls pane, click Calculate True to recalculate the true map using the parameters you have set interactively.
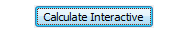
Click Calculate Interactive to revert back to Interactive mode.