Semi Variogram Map
You use Stats | Semi Variogram Map to create a variogram map. The upper half of the form relates to the input data, any transformations, and the map display.
The function uses a three-stage workflow to define the strike and dip of the plane containing Axes 1 and 2 (the orebody), and then measure the pitch of Axis 1 in that plane (the direction of greatest continuity). Once that is done, all of the other orientations (rotations, azimuth/plunge, etc.) are derived when needed.
The following workflow replaces the old method of creating fans of experimental variograms spanning a 180° range, greatly simplifying the process of finding anisotropy and determining directions:
-
Select Stats | Semi Variogram Map from the main menu.
- Set up the Raw Data, Transformation Options.
- Double-click the Palette box to choose a palette for the map colours:
- Enter initial parameters on the first row of the Processing Options grid. Ignore the rest of the form.
- Click OK to calculate the initial (Preview) map.
- Adjust the sliders to refine the parameters. (If you manually enter a number you must press Enter to apply the changes.)
- Click the Calculate True button to finalise the map.
Determine the Direction of Continuity on the Map
With the variogram map created you can now determine the direction of continuity, which is indicated on the map by a (hopefully) elliptical valley of low values running through the middle of the map:
- Use the Select Direction button to pick one or more directions.
- With the chosen Strike direction selected, click the Next button.
- Define the remaining two directions (Dip and Pitch), observing the azimuth and plunge displayed in the status bar as you go.
Strike and dip notation is inconsistent and must include the handedness of the measurement to make it unambiguous. In this case, the handeness of the strike is assumed to be right-handed. A right-handed strike is one where the structure slopes downwards to the right when viewed along the direction of strike.
Create a Variogram Control File
- Click the Next button
 to apply the directions to the bottom half of the main form.
The Next button will only appear as a tick when all necessary directions have been measured.
- Click the Generate Axis Report button, enter the name of a Variogram Control File, and click OK to create it.
To view the file contents, click the Generate Axis Report button and then right-click the Variogram control file response.
File
File
Select a file type and then double-click (or click on the select icon) to select the name and type of the File containing the raw data and specify the field from which the semi variogram will be calculated.
Filter
Select the Filter check box if you want to apply a filter to the data in the file. Enter a filter number in the adjacent response. Double click (F3) to see a list of existing filters. Right click (F4) to open the dialog box to create a new filter or edit an existing filter.
East, North, Z fields
Double-click (or click on the select icon) to select the fields that contain Easting , Northing and (optional) Z coordinates.
Data fields
Select the fields in the input file on which the semi variograms will be based. Optionally, specify a label for each field. Use the buttons on the grid list toolbar to Manage the rows in the list.
Variogram Type
Select an input variogram type:
| Type | Description |
|---|---|
|
Variogram |
A semi variogram (often abbreviated to variogram) is a graph of the average value differences (and thus the correlation) between sample pairs at different distances. |
|
Correlogram |
Displays the spatial correlation of the lagged data. |
|
Relative Variogram |
Scales the variogram by a function of the lag mean. |
|
Pair-Wise Relative Variogram |
A Pair-wise relative semi variogram may be used to model data that exhibits clustering and a strong positive skew. It reduces the influence of high values in the computation of the semi variogram, improving the interpretability of the graph. |
|
Covariance |
Displays the spatial covariance of the lagged data. |
|
Madogram |
(First Order Variogram): Displays the absolute values of the lagged data. |
|
Rodogram |
(Half order variogram): Displays the square roots of the lagged data. |
Note: The smoothness of the Madogram and Rodogram make them useful for determining the range and anisotropy of noisy data. Do not use them for interpolation.
Transformation Options
Transformation
If you need to transform the data in the analysis field before the calculation, choose the appropriate Transformation (e.g. NATURAL LOG) and enter the related parameters.
Additive constant
This input will be enabled if you have set Transformation to NATURAL LOG.
An additive constant can be used with a natural log transformation to force data which is near log normal to take on a log normal distribution. Since the additive constant is added to all values, it has the effect of increasing the Natural log of small values relatively more than large values; in effect rotating the graph of the natural logs of the data value to the right.
Cutoff value
This input will be enabled if you have set Transformation to INDICATOR.
Specify an indicator cutoff value. Values below the cutoff value will be changed to 0, and values above will be changed to 1, and the calculation will use the zeroes and ones instead of the original values.
![]()
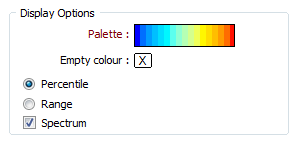
Display Options
Palette
Double-click on the Palette box to choose a palette. You can also right-click on the box to see a preview of the current palette.
Empty colour
Double click (F3) to select the colour which will be used to denote NULL or empty cells.
Range or Spectrum
Percentile is the default display option. Select Range to apply the colours in the chosen palette to each range. Select Spectrum to subdivide each percentile or range into eight equal parts, each with its own interpolated (or ramped) colour. This ensures that the colour coding is applied much more smoothly in the map.
Processing Options
In the lower half of the Processing Options group, define initial Strike, Dip, Pitch and Sense map settings.
Interactive Mode
This option is selected by default. When the check box is selected, only the first row of the Processing Options needs to be completed. The remainder of the form is interactively filled out during the modelling process.
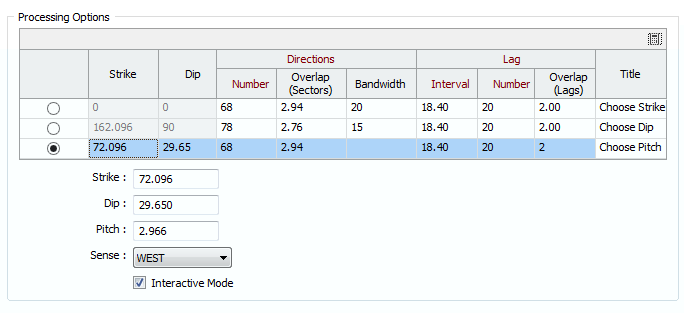
Strike and dip notation is inconsistent and must include the handedness of the measurement to make it unambiguous. In this case, the handeness of the strike is assumed to be right-handed. A right-handed strike is one where the structure slopes downwards to the right when viewed along the direction of strike.
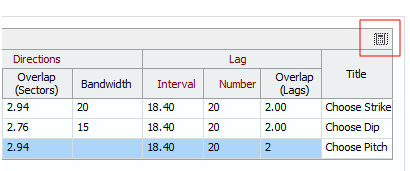
Directions
Number
The number of angular increments needed to define the full 360° circle of the map. For example, setting this to 72 will produce 5° increments (360 ÷ 72).
Overlap (Sectors)
Enlarges the pairing neighbourhood of the current sector by adding that number of sectors either side of it. For example, setting this to 1.5 will pair all points falling within 1.5 sectors either side of the current sector. Increase this value whenever there appears to be directional noise in the map.
Bandwidth
Optionally limits the width of the search sectors. For example setting this to 10 will prevent the sector search becoming any wider than 10 grid units (metres or feet) either side of the current direction.
Lag
Interval
The Lag Interval is the step size used to define radial distances on the map. For example, setting this to 25 will produce sectors at radial distances in 25 (grid unit) increments. This number should be close to the average sample spacing.
Number
The number of lags in the map. Together with the interval this defines the total radius of the map. For example, setting this to 15 with a lag interval of 25 will produce a map with a radius of 375 (grid units). This radius should be about one-half of the diagonal distance through the area under investigation. Reduce the number of lags if you see gaps around the outer edge.
Since the variogram map workflow is an interactive three-step process in which the lag interval and the number of lags for the second and third maps are determined after the direction on the preceding map has been measured, the Auto Calculate button will only set initial values for the first row.
It is normal to reuse the parameters from the previous map when advancing to the next, only adjusting the values of the next map if the values of the previous map are inappropriate.
Interval and Number of Intervals parameters for the second and third rows can (optionally) be auto-calculated in the second and third map displays, using the Lag Options group of the Chart Controls dialog:
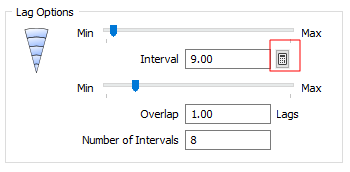
These parameters are then written back to the Processing Options grid.
Overlap (Lags)
Enlarges the pairing neighbourhood of the current lag by adding that number of lags in front of and behind it. For example, setting this to 2 will pair all points falling within 2 lags either side of the current lag. Increase this value when there appears to be radial noise in the map.
Forms
Click the Forms button to select and open a saved form set, or if a form set has been loaded, save the current form set.
By design the Forms button is not available for loaded Vizex layers (i.e. when opening the form set properties of a layer in the Display Pane). In Vizex, the Forms button is only available for new forms opened via the Display | Vizex menu (or by double-clicking on a form type node in the Vizex Forms Pane).
Save and Save As
Click the Save button to save the changes you have made to the form set. Click Save As to save your changes as a new form set. Save As will default to the first available form set number.
Reset
Click Clear to clear the form of all values and reset the form to its default state. In the case of tabbed forms, set the first tab as the active tab.
Undo and Redo
Click Undo (CTRL + Z) to undo recent changes in the form. After an Undo, click Redo (CTRL + Y) to restore the last change that was undone.
Collapse
Collapse (roll-up) the form to preview a chart, or preview the results of an operation in Vizex, or obtain input values from Vizex, the Property Window, the File Editor, or the Plot Editor.
OK
Finally, click OK to generate the semi variogram map.