Omnidirection and Downhole Semi Variograms
Omnidirectional semi variograms are used for investigating the degree of spatial continuity in a dataset by searching for data pairs in all directions through the dataset.
If spatial continuity exists (that is, if the sample grades - or a transformation of these to logs, ranks or indicators - in one location are statistically related to sample grades in other locations) a sensible looking (though probably poorly-formed) semi variogram will be generated.
Conversely, if there is no spatial continuity in the data set, no sensible semi variogram will be formed.
A lack of spatial continuity does not mean that the samples are not representative of a spatially continuous ore deposit; rather it indicates that no rule can be established statistically to define the way in which a set of observations at one location, or a series of locations, can be used to predict the value at another location.
Downhole semi variograms are useful for the investigation of nugget values to be used when modelling directional semi variograms. The nugget measures the amount of random variation in close-spaced measurements. That is, even samples taken from locations very close to each other will show significant (random) variation.
When you select Downhole or Omnidirectional as the Input direction, a form is displayed which provides options that allow the semi variograms to be generated and displayed in a single pass. The direction is along the hole and no tolerance is needed.
Options
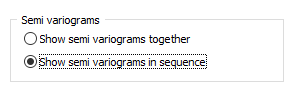
Show semi variograms together
Select this option to show all defined semi variograms together.
Show semi variograms in sequence
When this option is selected, the first semi-variogram is displayed. Select Next or Previous from the menu to show the next or previous semi-variogram.
You can toggle between these two display modes from the toolbar when the graphic display is open.
Include zero interval
In some cases it may be useful to include the zero lag interval in the semi-variogram calculation. If this option is selected, pairs of samples in the zero interval lag are used to calculate the gamma value of the first point in the semi-variogram.
For example, let's take lag distance 70 m. Because the default setting for the lag tolerance is half the lag distance, the first lag interval is from 35 to 105 m, second is from 105 to 175 m and so on. In this case "zero interval" is from 0 to 35 m.
Lag
Intervals and Number of Intervals
You need to define the interval size and the number of intervals to control which values the semi-variogram calculation will use. In geostatistics the Interval is called a Lag.

Directional and omnidirectional semi variograms group samples into distance intervals. Pairs of samples at distances equal to the product of the interval number and the interval, plus or minus half the interval size, are included in the calculation for a search volume.
The maximum distance covered in the search for values is the product of the Interval size and the number of Intervals. Generally this distance is approximately half of the sample coordinate range for a particular direction.
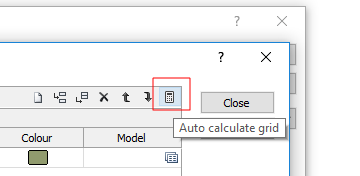
An auto-calculate button can be used to calculate appropriate Interval and Number of Intervals parameter values.
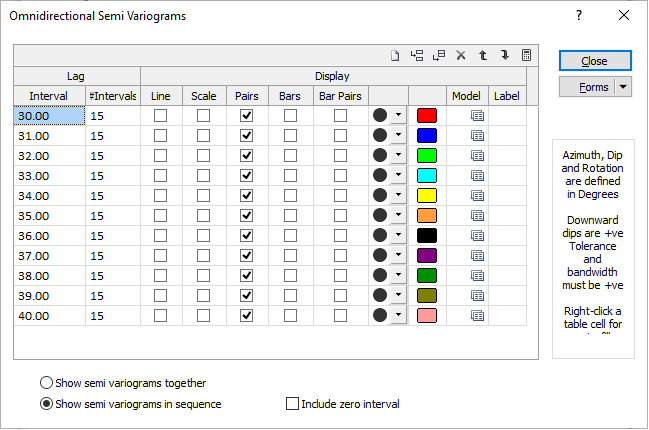
Display
Display mode
Once you have entered the azimuth and plunge for each search direction, you need to define how they will be displayed. Alternatively, you may choose not to select a display mode when you want to switch a direction off temporarily to simplify the display.
One or more of the following options may be selected to control the way the graph of each semi-variogram is displayed:
- Line The Line display option displays a simple line graph. The corresponding marker symbol will appear at each interval distance. Its size will vary proportionally to the number of pairs in that interval.
- Scale The Scale display option displays a scaled symbol. The interval semi-variogram value for the azimuth is scaled relative to the number of pairs in the interval.
- Pairs The Pairs display option displays a fixed size symbol with the number of pairs written beside the symbol.
- Bars If selected, the Bars option will display bars, which represent the number of pairs within each bin, below the main graph.
- Bar Pairs If selected, the Bar Pairs option will label the number of pairs within each bin, below the main graph. This option may be selected independently of the Bars option.
Marker
Select a marker symbol For each semi-variogram. A range of standard (Circle, Square, Diamond, Pentagon, Hexagon, Star, Triangle, Plus, Cross) marker symbols are available for selection in a drop-down list.
Colour
For each semi-variogram, double click on the Colour button (or press F3) to display a colour palette to select from.
Model
To summarise the final model, it is often useful to display the raw data alongside the experimental semi variograms. Double-click on the form set icons to select a Model that most closely resembles the experimental semi variogram you have created. Once you have done that, you can refine the characteristics of the model by changing its coefficients. See: Semi Variogram Model
Once satisfied with a match you can save the model coefficients as another form set.
Label
Optionally, specify a label for each semi variogram. You can use the Show direction labels check box, on the Display tab of the Semi Variograms form, to show or hide the labels.
Forms
Click the Forms button to save the parameters you have defined in the Omnidirectional Semi Variograms form as a form set. Conversely, you can populate the parameters of the form using a saved form set.
New
Click the New button to empty the current set of values displayed in the Omnidirectional form.
Close
Click Close to return to the Semi Variograms form.