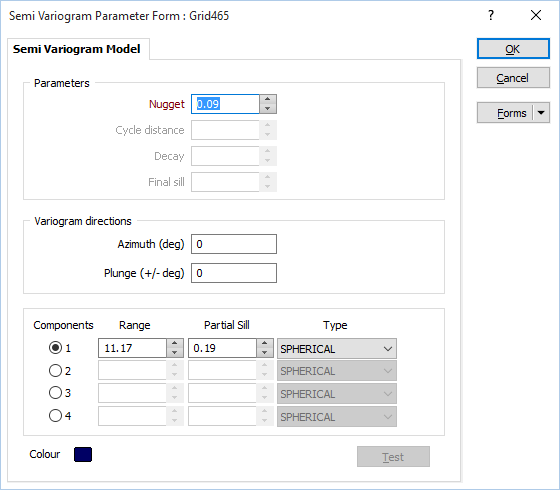
Semi Variogram Model
When modelling, the primary objective is to select a model that most closely resembles the experimental semi-variogram you have created. Once you have done that, you can refine the characteristics of the model by changing its coefficients. Once satisfied with a match you save the model coefficients as a form set.
The Semi Variogram Model form can be opened by selecting Edit (F4) from the right-click menu in an Omindirectional or Directional Semi Variogram prompt, or via a Direction prompt (in Grid | Create, Stats | Cross Validation, and Kriging).
When you run the Stats | Semivariogramfunction, if you select the Show semi variograms check box you can view the parameters of the semi variograms you have calculated in a Chart Controls pane to the right of the chart.

|
To edit those parameters, click the Edit Parameters button on the Chart toolbar. |
The direction of the model you have selected in the Input Data form will determine which of the following inputs are enabled. In some cases the names of the inputs will change.
All response boxes have spin controls associated with them and these provide a quick way of adjusting the values. The controls are set up to increment the increment value (change gear) over 10 consecutive increments by a factor of 10. You can therefore use these to quickly make both fine and coarse adjustments.
You can set model parameter Display in the Semi Variograms form.
Nugget
Enter the Nugget value. The Nugget value (effect) is the variance at distance zero. This is always less than or equal to the sill. The nugget effect arises because the regionalized variable is erratic over a very short distance (less than the sampling interval).
Slope / Cycle distance
For a Linear model enter the Slope of the line.
For a Hole Effect or Paddington Mix model, enter the Cycle distance (the distance between peaks and troughs).
Decay / Power
For a General Linear model enter a Power that will be used with the Slope to calculate a Range.
For Hole Effect or Paddington Mix variogram models, enter a damping factor. This is an inverse function - the smaller the factor the faster the damping.
Final Sill
Enter the Final sill. The Final Sill is the semi variogram (Y axis) value of the final or highest sill in multiple component variogram models.
Variogram directions
Define the variogram direction by entering Azimuth and Plunge values. These values are used internally to define the model's Anisotropy.
Number of components
Note that some semi variogram model types only allow one component to be defined. Where multiple components are allowed, the number of components can be set (or updated) and the associated range, partial sill, and model type can be entered for each component.
Range
Enter the range of the components of the semi variogram model. The range is the distance where there ceases to be an identifiable relationship between sample pairs.
Partial Sill
Enter the Y coordinate (semi variogram) value of the sill for each component of the model. This is constant for a dataset.
Model type
The type of model should have a general shape which resembles the experimental semi variogram.
Forms
Once you have refined the model's characteristics, save them as a form set. This form set will then be accessible in Gridding, Cross Validation, and the 3D Block Kriging functions.
Test
(Optionally) Click the Test button to test how well the semi variogram model fits. A Noel Cressie statistic, a form of least squares prediction, is calculated for each direction and appears in the numeric display.
It is calculated as the sum of the squared difference between each experimental point and the model value at the same distance. The lower the value, the better the fit. Note that the actual value is heavily dependent on the data.