Create a Graphic Report
To create a Graphic Report:
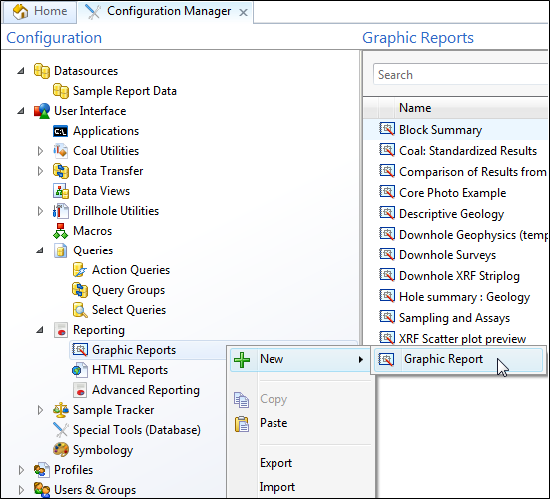
- In the Configuration Manager, right-click on the User Interface| Reporting | Graphic Reports node of the navigation tree and select the New | Graphic Report option from the menu.
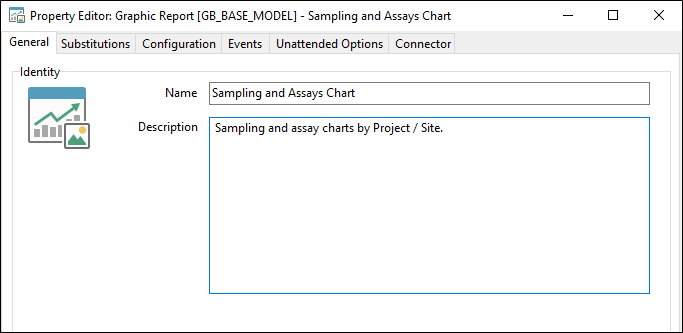
- Enter the general properties (Name, Description) of the report you are creating. The report name will be shown on the title bar of the property editor when you subsequently edit the report.
- If you need to prompt the user for values when running queries, use substitution parameters (for example HOLE_ID = '?Enter the Hole ID?') can be inserted.
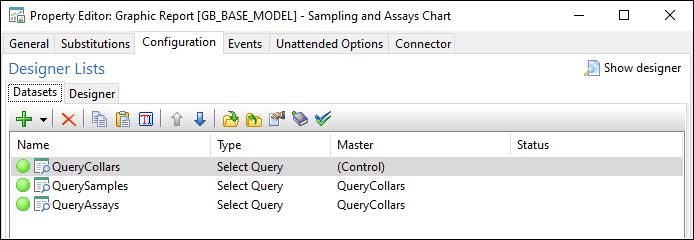
- To configure the report by setting up a Dataset List and a Designer List, click on the Graphic Reports Configuration tab.
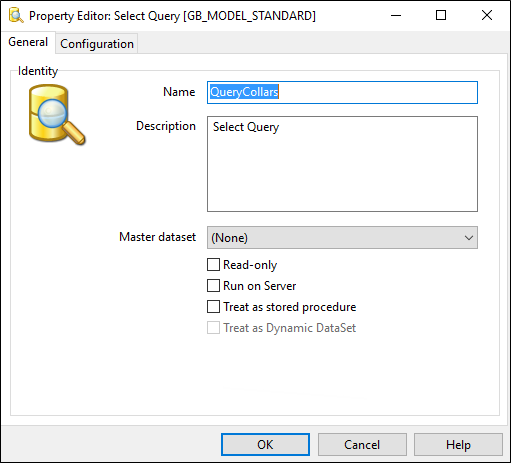
- Double-click on a query to select it. You will see the following:
- To configure the messages to be shown, or the scripts to be executed, when the task form is opened or closed, click on the Property Editor: Event tab.
- To configure the default location for printed report output, click the Unattended Options tab.
- To setup the Connector, click on the Graphics Report Data Connectivity.
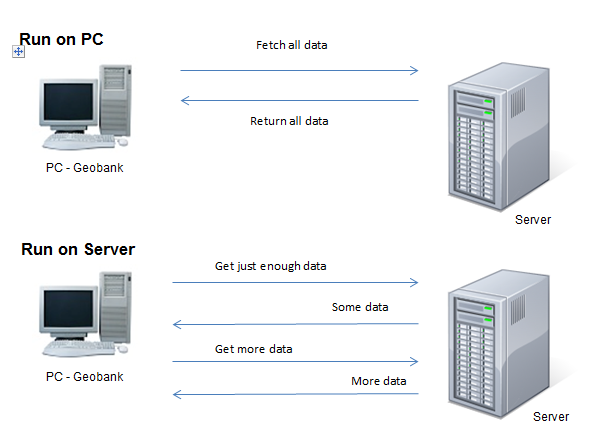
Run on Server
Running on the PC requires that all data is stored in memory. This can cause crashes when dealing with large datasets (e.g. over 1 Gbyte)
The "Run on Server" option allows the data to be broken into manageable chunks. Each chunk of data is verified as it is received, so the process is more reliable.
There is an increased "per record" fetch time, so tasks like importing and exporting data will run slower.
To execute a report
Either double click on the Graphic Report's icon or select the Graphic Report's icon in the reports window and click the Execute button on the Ribbon.
