Templates
The Graphic Reporter uses a number of standard templates to organise and display data. In essence, a report is compiled by arranging several templates on a drawing page and linking these templates (where appropriate) to one or more items of data provided by the datasets.
For example, you could use a simple field label to display the value of a given field (the drillhole number) from the collars dataset. The downhole lithological log, on the other hand, is best displayed as a graphic column, where each lithology code can be represented by a predefined hatch pattern. This graphic column can be scaled by way of a vertical scale bar, based on the depth range of each individual lithology interval.
The actual decoded descriptive text, as recorded by the geologist, can be displayed as a text column, scaled by the same vertical scale bar. Various other data categories can be displayed by simply adding more templates (such as line graphs and bar graphs representing assay values).
Templates List
Just about everything you see in a graphic report is based on the template objects you have added from the Templates Toolbar.
You can also add, re-order and filter the templates on each data sheet, using the Design Sheet toolbar:

|
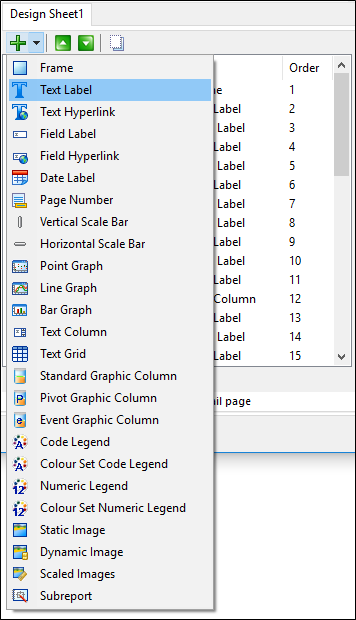
Select a template from the Add Template tool menu: |
|
|
|
When you add a template object onto the current design sheet, the property editor of the template object is displayed. You can adjust the position and size of the object and set other properties. |
|

|
Click Move Up to move selected template objects up the list. |

|
Click Move Down to move selected template objects down the list. |

|
Click the Hide Unselected button to filter the Templates list to only show those objects currently selected in the design sheet. When the selection in the design sheet is changed, all objects are shown in the Templates list. |
Setting the controlling template
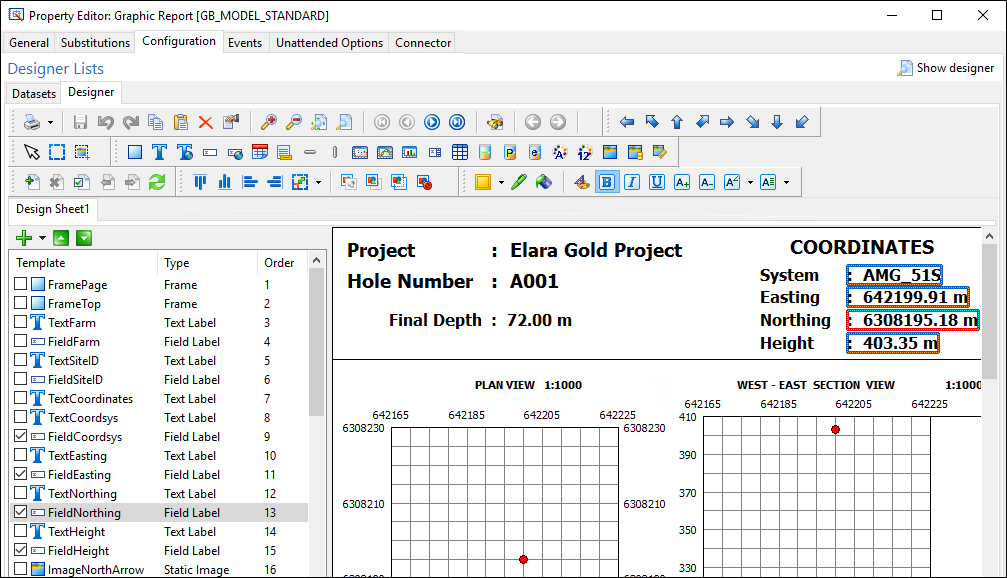
When selecting multiple templates (objects) for group operations (alignment, font, etc.) by default the first selected object is designated as the controlling object and is shown with a red border. All other objects are shown with a blue border.
When an Align or Resize action is selected, the blue objects are matched to the red object:
You can quickly change the controlling template without having to reselect all the objects. Simply click on another object (not the check box) in the template list. If the object you have selected is part of the selected group, it will be set as the controlling template and its border colour will be changed to red.
To adjust the size and position of selected template objects, see: Modify Size and Position.