View a Graphic Report
Reports are made available for viewing in one or more profiles. To view a Graphic Report:
- Select the report you want to view.
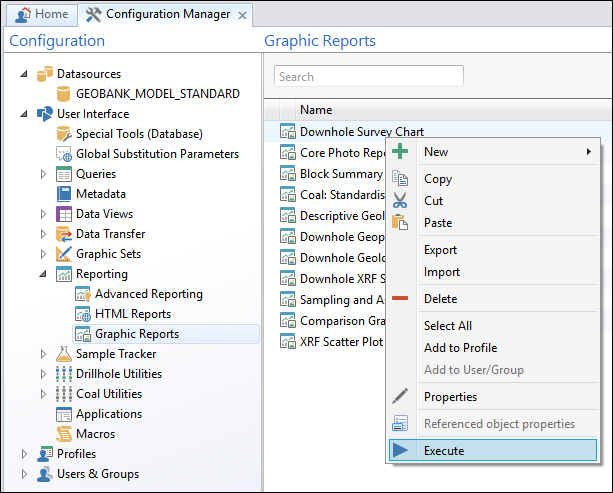
- Double-click on the report (or right-click on the report and select Execute from the right-click menu).
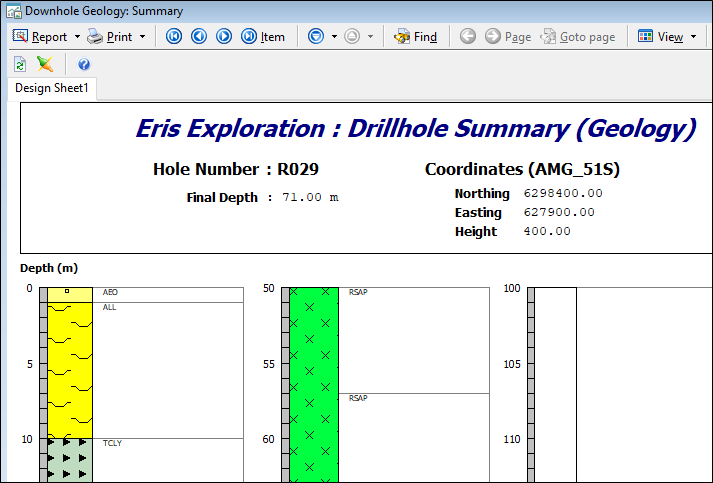
The report is displayed in the Graphic Reporter Viewer. Use the options on the Toolbar to navigate the display or manipulate the view.
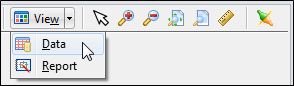
While a graphic view of the data is the default, you can use the View menu to view the data for the report.

|
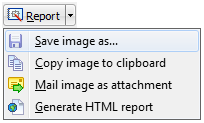
Use the options on the Report menu to save or distribute the report in a number of formats.
|
|
|
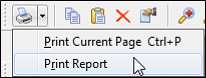
Use the options on the Print menu to print the current page of the report or print the entire report. If you are viewing the data from the report, the data will be printed.
|
|
|
Use the First item, Previous item, Next item, Last item buttons to navigate the report. |
|
|
Use the Go to Previous Bookmark and the Go to Next Bookmark buttons to navigate a history list of the bookmarked items you have browsed in the current report. |
|
|
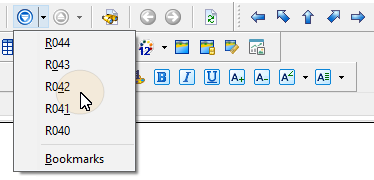
To move to a recent bookmark, select a bookmark from the drop-down history list. |
|
|
To select from a complete list of bookmarks, click on the Bookmarks option. See: Bookmarks |
|
|
|
|
|
Use the Find button and the Go to page button to locate a specific item, or move to a specified page for the currently selected item. In a Project Summary report, for example, an item would be a "project". For downhole graphics, an item typically represents a "drillhole" (a record in the controlling dataset). The Goto page function is only relevant in cases where a report generates more than one page per item, and where the paging is controlled by a scale bar. |
|
|
Use the Previous Page and Next Page buttons to navigate through the report page by page. |
|
|
While a graphic view of the data is the default view, you can use the View menu to view the Data from the report.
Extra tools are provided which let you Search, Filter, or Sort the data.
|
|
|
Use the Zoom tools to zoom in or out on the report. You can display the actual size of the report or fit to page. |
|
|
Select the Scale Bar Settings button to Property Editor: Scale Bar in the report. |
|
|
Click the Show horizontal line tool to enable or disable the display of a horizontal line that shows the depth down hole at the position of the mouse cursor. When the tool is enabled, you can insert a horizontal line that is detached from the mouse position using CTRL + Left mouse click, or by pressing CTRL + Insert after digitising a position point. |
|
|
Click the Refresh Data button to re-run the underlying queries to load new data into the report. |
|
|
Click the Connector button to link a Plan View, or Section View, or Correlation Diagram, to drawings produced in the Graphic Reporter. In order for Graphics Report Data Connectivity to work, the Plan View, or Section View, or Correlation Diagram and the Graphic Reporter must both be open. |
|
|
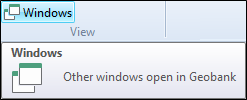
Use the Windows menu button to switch between different windows when you have more than one report open.
|
|
|
To close the Viewer window, click the Close button at the top right of the window. |


Horizontal and vertical scroll bars can be used to see those parts of the report that are not currently visible on screen. Note however, that it is not possible to scroll across the entire report for page sizes greater than A4 (unless you zoom in or out ).
The graphic report viewer is opened in 'browse' mode and you cannot modify the properties of the report. Reports are configured by an administrator using the Configuration Manager.