2D Plot Frame
A 2D Plot frame contains the data in a generated (.PEL) plot file.
To create a plot file that can be opened in a 2D Plot frame, select the Plot | Generate Plot File menu option when the data you want to plot is open in a Vizex, Graph, or Quick Log window.
To add a new 2D Plot frame:
- Double-click on the 2D Plot frame type in the Plot Forms pane.
- Set the properties of the 2D Plot:
- If you are using the plot to display a section view of your data and want to link it to a plan view, select Plan plot from the drop-down list.
- If you are using the plot to display a plan view of your data and you want to link to a section view, select Section plot from the drop-down list.
- If you are using the plot to display your data and you want to link to other data, select 2D plot from the drop-down list.
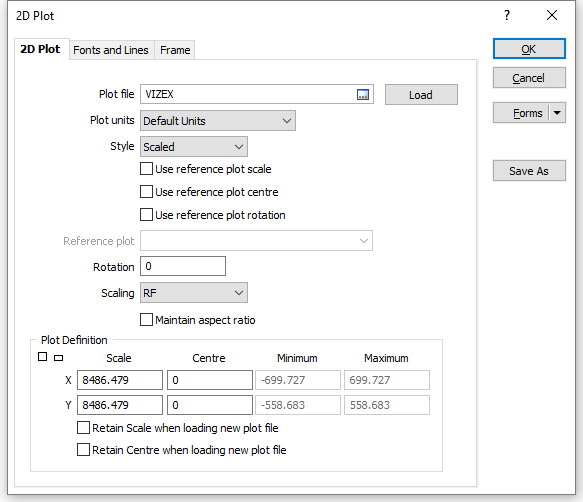
Plot file
Enter or double-click to select the name of the plot file that will be opened in the 2D Plot frame. After making changes to the parameters in the form, you can use the Load button to load the original parameters from the file.
When a new plot file is loaded or the Load button is used to load parameters from the file, scale and centre parameters will not be overridden when the Retain Scale and Retain Centre options are selected. If both options are selected, the Load button is disabled.
Style
The application supports both normal SCALED plots and FIT TO FRAME plots.
The default style selection is SCALED. In most cases you want the scale that was applied when the plot file was created to be applied to the plot.
With FIT TO FRAME plots the X and Y scales are adjusted so that the original display area fits within the extent of the frame.
When you choose the SCALED option and define a centre, the contents of the frame will be scaled according to the selected paper size. That is, the plot extents will remain the same no matter what the frame size.
Use Reference Plot Scale
Select this option to link the scale of the plot frame to the scale of a Reference Plot Frame. Otherwise, enter the X and Y scale of the plot in the Plot Definition group (see below).
Use Reference Plot Centre
Select this option to link the centre of the plot frame to the centre of a Reference Plot frame. Otherwise, enter the X and Y coordinates of the plot centre in the Plot Definition group (see below).
Use Reference Plot Rotation
Select this option to link the rotation of the plot frame to the rotation of a Reference Plot frame.
Reference plot
If you have selected a Use Reference Plot option, select the plot that will be used to reference the scale and/or the centre of the 2D plot.
When you select the Use reference plot options, the scale, centre, and rotation of the plot will be updated whenever the scale, centre, and rotation of the Reference Plot frame is changed.
Rotation
To rotate the plot, enter the rotation in degrees (0 to 360°) clockwise. This option will be disabled if you have selected the Use reference Plot Rotation option (see below).
Scaling
To specify a unit of measure for the scale, select an option from the drop-down list.
By default, the scaling units are set to to RF (Representative Fraction). The RF is the numerical scale of a map which indicates the relationship of distance measured on a map and the corresponding distance on the ground. The RF is always written with the map distance as 1 and is independent of any unit of measure. (It is usually metric, but could be yards, meters, inches, etc.)
For example, an RF of 1/50,000 or 1:50,000 means that one unit of measure on the map is equal to 50,000 units of the same measure on the ground.
When the Maintain aspect ratio checkbox option is selected, the Y Scale is recalculated from the X Scale and the current aspect ratio.
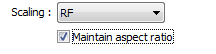
This makes it possible to change the plot scale when vertical exaggeration is set.
In Vizex, downhole ticks, labels, and graphs etc are drawn at right-angles to the trace. For the angles to be correct when plotting a section with vertical exaggeration set, the exaggeration in the plot must match the exaggeration that was set in Vizex (at the time the plot file was generated).
Scale, Centre, Minimum & Maximum
If you have selected a Scaled plot style, enter the scale and centre X and Y coordinates of the plot.
If you have selected the Use Reference Plot Scale and Use Reference Plot Centre options (see above), the X and Y Scale and Centre inputs will be disabled.
If you have selected a Fit to frame plot style, the scale and centre X and Y coordinates of the plot are adjusted so that the plot fits within the extent of the parent frame. You can then adjust the centre and minimum and maximum X and Y coordinates of the plot, if necessary.
Retain Scale and Retain Centre when loading new plot file
Select the Retain Scale and the Retain Centre check box options to retain the scale and centre parameters in the form when a new plot file is loaded, or when the Load button is used to load the original parameters from the Plot file. If both options are selected, the Load button is disabled.
- Set the font and line properties of the frame in the Fonts and Lines tab.
- Set the border and margin properties of the frame in the Frame tab.
- Finally, click OK to add the 2D Plot frame to the layout.