Viewing the chart
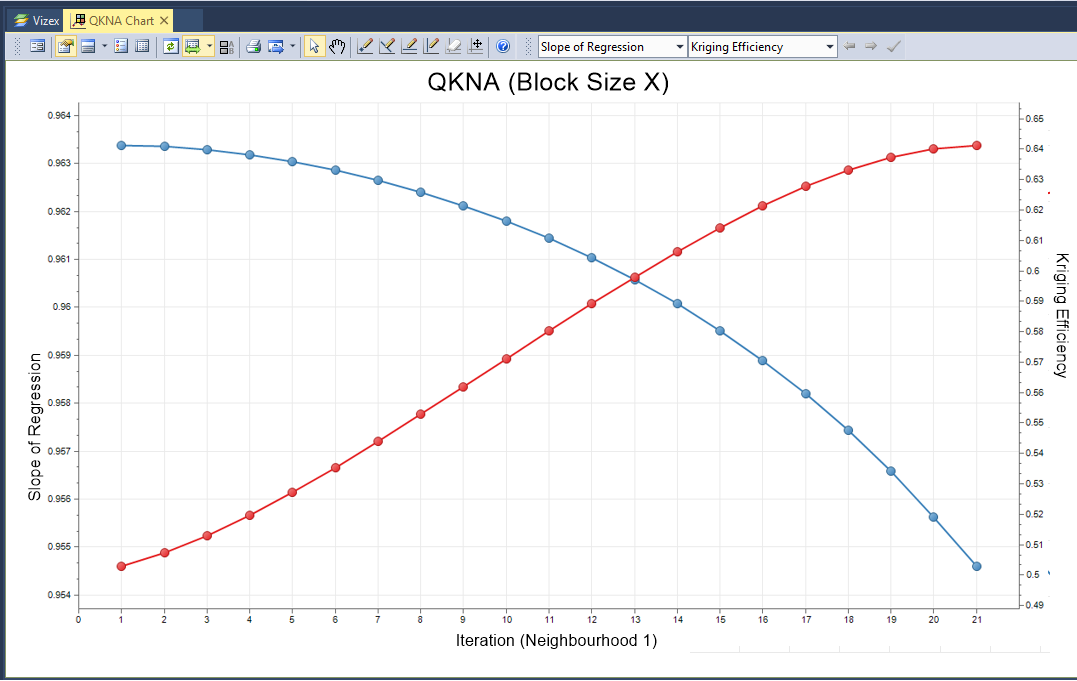
The QKNA chart plots Kriging Efficiency versus Block Size and may be used to select an optimal block size for modelling.
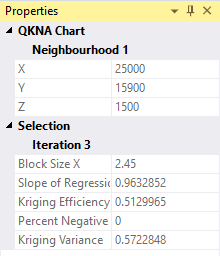
The Chart window comprises two parts: the graph and the properties window:
Redisplay the Chart form
To redisplay the Chart form:
- Click the Form button at left of the Chart toolbar

- Alternatively, double-click on the chart's name in the Display Pane
Interact with the chart
Zooming and panning within a chart relies on the middle mouse wheel button:
- To zoom in or out: roll the mouse wheel towards or away from you
- To zoom the X-axis only: roll the mouse wheel whist holding the Ctrl key
- To zoom the Y-axis only: roll the mouse whilst holding the Shift key
- To pan the chart (when zoomed in): drag with the middle mouse button
History
When you right-click in a chart, a context menu lets you choose from a History of recently-used functions.
If a tool is active (i.e. Panning), right-clicking in the Chart window will deactivate any active tools. Right-click again to view the context menu.
Chart toolbar
The options on the left-hand side of the toolbar are applicable to most charts:
| Button | Description |
|---|---|
|
|
Click the Form button to open the form associated with the generated chart. |

|
Click the Properties button to view the properties of the chart in a Property Window. |

|
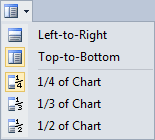
If properties are supported for the type of chart being created, click the Chart Properties button to show properties on the chart itself. Options that determine the position and the width of the Properties pane are provided. |
|
|

|
Click the Show Legend button to display a legend on the chart. See: Legend |

|
Select the Show File button to open the input file alongside the chart. You can use the Sync Selection options on the Chart toolbar to synchronise data selections in Vizex or the File Editor. See "Sync" below. |

|
Click the Refresh button to refresh the chart. This may be necessary when changes have been made to the underlying data. |

|
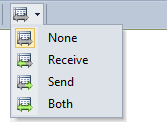
Use the options on the Sync tool menu to synchronise selections between the chart and a Vizex layer or the File Editor. See: Synchronising data selections |
|
|
| You can tile a chart with Vizex by right-clicking the tab at the top of the chart window and choosing New Vertical Tab Group from the pop-up menu. | |

|
If a colour set has been applied to the chart, click the Colour Set button to show the colour set in a legend. |

|
If a symbol set has been applied to the chart, click the Symbol Set button to show the symbol set in a legend. |

|
If a palette has been applied to the chart, click the Show Palette button to toggle the display of the palette on and off. |

|
Click the Print button to send an image of the chart to a printer. The chart will be re-scaled so that a best-fit of the page is achieved, while still maintaining the aspect ratio. |

|
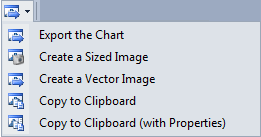
Click the Export button to Export the Chart: |
|
|

|
Click the Select tool to interact with some types of chart. |

|
Click the Pan/Zoom tool and then scroll the mouse to zoom, or click and drag the mouse to pan. |

|
Click the Point Annotation tool to use the mouse to digitise a point on the chart. |

|
Click the Label Annotation tool to use the mouse to digitise a point to set the position of a label on the chart. For more information, see: Data Annotations. |

|
Click the Line Annotation tool to use the mouse to digitise two points to set the position, length, and orientation of a line on the chart. |

|
Click the Horizontal Line Annotation tool to use the mouse to digitise a point to set the position of a horizontal line on the chart. For more information, see: Data Annotations |

|
Click the Vertical Line Annotation tool to use the mouse to digitise a point to set the position of a vertical line on the chart. |
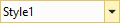
| Select the active Chart Annotation Style. Annotations created interactively will use this style. | |
|
|
| Note that annotation styles are created and edited in the underlying form, not on the chart itself. | |
|
|
Click the Clear Annotations button to clear the annotations added to the chart. |

|
Click the Move Annotations button to move selected annotations. Left-click the mouse to position the annotations you are moving. |

|
Click the Help button to view an online help topic for this function. |
Other tools on the Chart toolbar are specific to the type of chart displayed. In the QKNA chart, you can:
| Button | Description |
|---|---|
| Select the measure that will be displayed on the Y axis.
|
|
| Select the measure that will be displayed on the X axis.
|
|

|
View the previous iteration/neighbourhood (Left key). |

|
View the next iteration/neighbourhood (Right key). |

|
Apply the currently selected test variables. |