Ternary Diagram
Stats | Ternary Diagram uses data from three fields to construct a triangular graph in which the position of each point is determined by the ratio (percentage) of the three components.
A typical application is the display of oxide components of whole-rock analysis.
You can label the axes or the corners of the triangle, display points as symbols, colour code by theme, colour blending, colour set, or colour density, and group points using interactive tools on the Chart toolbar.
Input
File
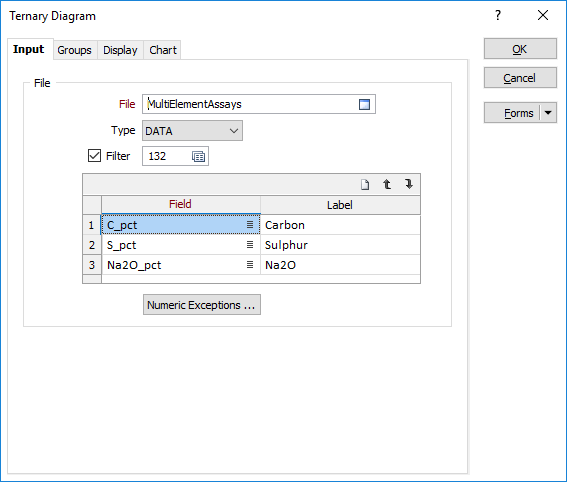
On the Input tab of the Ternary Diagram form, select a file type and double-click (or click on the Select icon) to select the name of the file containing the source values. If required, define a filter to selectively control which records to process.
Fields
On each row of the grid, double-click (or click on the Select icon) to select the name of the three fields containing the values that will be plotted on the chart.
Note that default labels in charts often use the input field name to label the data being plotted. If these fields are expressions, then the expressions will be used as the label text. To avoid this, you can use an additional attribute to define the label. See: Output field name attributes in Chart labels
You can use the buttons on the toolbar (or use the right-click menu) to manipulate the rows in the list.
When you right-click on a field selection, a number of utilities including dynamic field expressions are supported. See: Expression Editor
Numeric Exceptions
(Optional) Use the Numeric Exceptions group to control the way that non-numeric values are handled. Non-numeric values include characters, blanks, and values preceded by a less than sign (<).
OK
When you have set Groups and Display options for the Ternary Diagram, click OK to generate the chart.
Forms
Click the Forms button to select and open a saved form set, or if a form set has been loaded, save the current form set.
By design the Forms button is not available for loaded Vizex layers (i.e. when opening the form set properties of a layer in the Display Pane). In Vizex, the Forms button is only available for new forms opened via the Display | Vizex menu (or by double-clicking on a form type node in the Vizex Forms Pane).
Save and Save As
Click the Save button to save the changes you have made to the form set. Click Save As to save your changes as a new form set. Save As will default to the first available form set number.
Reset
Click Clear to clear the form of all values and reset the form to its default state. In the case of tabbed forms, set the first tab as the active tab.
Undo and Redo
Click Undo (CTRL + Z) to undo recent changes in the form. After an Undo, click Redo (CTRL + Y) to restore the last change that was undone.
Collapse
Collapse (roll-up) the form to preview a chart, or preview the results of an operation in Vizex, or obtain input values from Vizex, the Property Window, the File Editor, or the Plot Editor.