Viewing the diagram
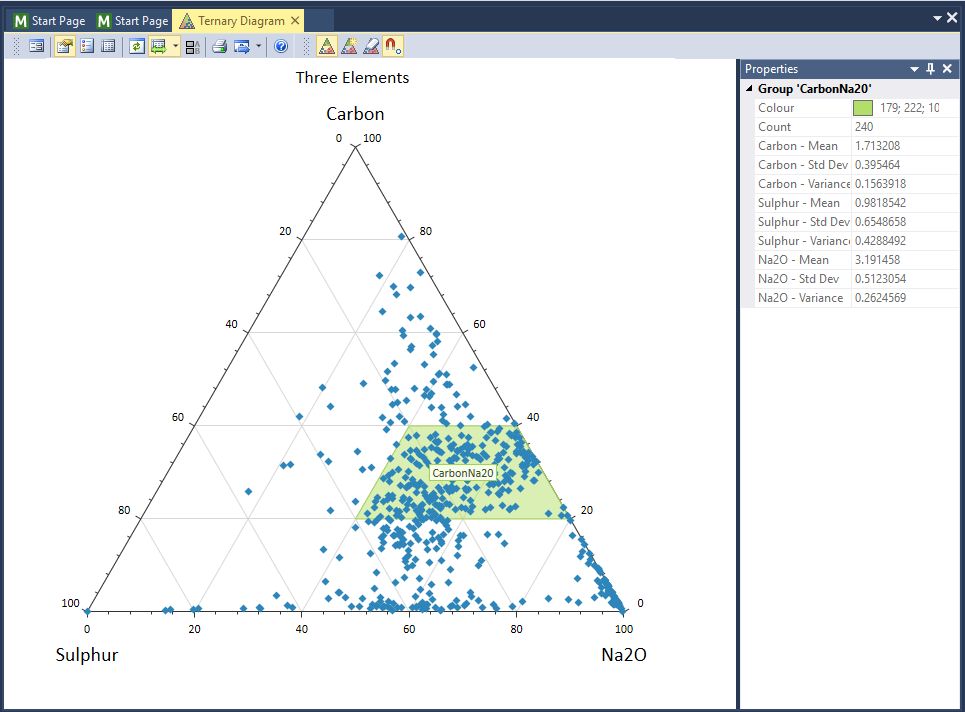
The Ternary Diagram uses data from three fields to construct a triangular graph in which the position of each point is determined by the ratio (percentage) of the three components.
Points may be interactively selected and grouped using tools on the Chart toolbar.
Redisplay the Chart form
To redisplay the Chart form:
- Click the Form button at left of the Chart toolbar

- Alternatively, double-click on the chart's name in the Display Pane
Chart toolbar
The options on the left-hand side of the toolbar are applicable to most charts:
| Button | Description |
|---|---|
|
|
Click the Form button to open the form associated with the generated chart. |

|
Click the Properties button to view the properties of the chart in a Property Window. |

|
If properties are supported for the type of chart being created, click the Chart Properties button to show properties on the chart itself. Options that determine the position and the width of the Properties pane are provided. |
|
|

|
Click the Show Legend button to display a legend on the chart. |

|
Select the Show File button to open the input file alongside the chart. You can use the Sync Selection options on the Chart toolbar to synchronise data selections in Vizex or the File Editor. See "Sync" below. |

|
Click the Refresh button to refresh the chart. This may be necessary when changes have been made to the underlying data. |

|
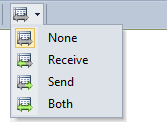
Use the options on the Sync tool menu to synchronise selections between the chart and a Vizex layer or the File Editor. See: Synchronising data selections |
|
|
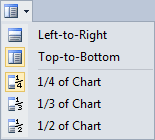
| You can tile a chart with Vizex by right-clicking the tab at the top of the chart window and choosing New Vertical Tab Group from the pop-up menu. | |

|
If a colour set has been applied to the chart, click the Colour Set button to show the colour sets in a legend. |

|
If a palette has been applied to the chart, click the Show Palette button to toggle the display of the palette on and off. |

|
Click the Print button to send an image of the chart to a printer. The chart will be re-scaled so that a best-fit of the page is achieved, while still maintaining the aspect ratio. |

|
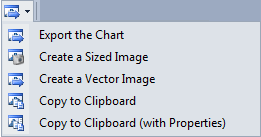
Click the Export button to Export the Chart: |
|
|

|
Click the Help button to view an online help topic for this function. |
Other tools on the Chart toolbar are specific to the type of chart displayed. In the Ternary Diagram, you can:
| Button | Description |
|---|---|

|
Toggle groups visibility. |

|
Select points to create a group. |
|
|
Clear all groups added to the diagram. |

|
Snap to grid when creating a group. |
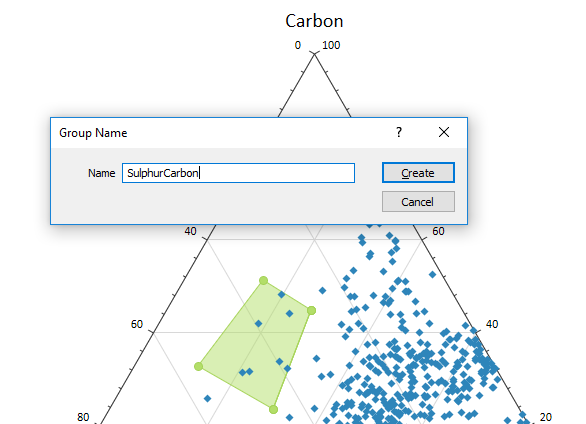
Create Group
- Optionally, enable the Snap to grid button before digitising the extents of your point selection.
- Click the Create Group button.
- Use the mouse to digitise an area which encompasses the points you want to group.