Designer Toolbar
Use the tools on the Designer toolbar to manipulate the objects you have added to a design sheet:
|
|
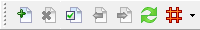
Use the Sheet buttons to Add a new design sheet to the report, Delete the current design sheet, Move through multiple design sheets, view the Property Editor: Design Sheet of the current design sheet, and Redraw the current design sheet. |

|
Click the Show Design Grid button (SHIFT + F9) to show/hide the Design Grid. You can also select an option to toggle Snap to Grid mode on and off. See: Design Grid |
|
|
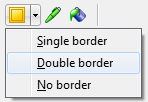
Use the Border, Pen Colour, and Fill Colour buttons to set the border, pen colour, and fill colour properties of the object currently selected. |
|
|
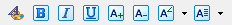
Use the Font buttons to set the font characteristics of a selected text object. You can quickly set Bold, Italic and Underline styles, adjust the font Size up and down, set a font Angle, and set the text Alignment.
|

|
Use the Select templates within area tool to select those template objects that intersect the extent rectangle you define with the mouse. |

|
Alternatively, use the normal Select tool with the CTRL or SHIFT key to select multiple objects. |

|
Or click the Select All button to select all objects. |

|
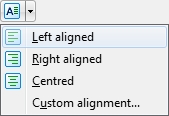
The selection rectangle must either intersect with the frame of an object, or completely encompass the frame of an object, in order to select that object. You can then use the Alignment buttons to set the vertical or horizontal alignment of the objects you have selected. |

|
Interactively resize objects by dragging their extents with the Select pointer, or use the Adjust Sizes tool menu to resize them.
|

|
The Align Scaled button is only activated when a single scale bar is selected. This button affects all templates that are scaled by the scale bar. |
| In the case of a vertical scale bar, all associated templates will be aligned to the top of the scale bar and all heights will be set to match that of the scale bar. | |
| In the case of a horizontal scale bar, the left edges and widths of all associated templates will be set accordingly. | |
|
|
Use the Nudge buttons to move the object or objects selected in the current design sheet. Hold down the keys for continuous movement. Note that you can also hold down the ALT key as you drag selected objects with the mouse. |
|
Use the Send to back and Bring to front buttons to adjust the draw order of the object. Where objects overlap, you can also use a Make transparent tool set the transparency of an object so that underlying objects are not obscured. |
| You can hide and show selected objects using the Show/Hide toggle button. |

A number of standard tools are also provided (on the bottom row of the toolbar):
|
|
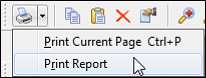
Use the options on the Print menu to print the current page of the report or print the entire report. If you are viewing the data of the report, the data will be printed.
|
|
|
Click the Copy button to copy an object currently selected in the design sheet. You can then create a new object by using the Paste button to add the copied object to the sheet. Templates can be copied and pasted between reports and design sheets, but care should be taken to ensure that any templates copied to another report are appropriate for that report. |
|
|
Click the Remove button to remove the object currently selected in the design sheet. You will be prompted to confirm the deletion. |
|
|
Click the Properties button to view (and optionally edit) the properties of the object currently selected in the design sheet. |
|
|
Click the Undo button to undo the last action performed on the objects in the current design sheet. |
|
|
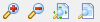
Use the Zoom tools to zoom in or out on the report. You can also display the actual size of the report or fit to page. |
|
|
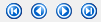
Use the navigation tools to move from one report item to the next, or from one page of the report to the next.
|

|
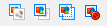
Click the Refresh Data button to re-run the underlying queries to load new data into the report. |
|
|
Use the Find Item tool to locate a specific item for the currently selected item. In a Project Summary report, for example, an item would be a "project". For downhole graphics, an item typically represents a "drillhole" (which is a record in the controlling dataset). |