Design Considerations
This topic is aimed at administrators who wish to edit a report or configure a new report using the dataset and design tools provided in the Graphic Report Property Editor.
Some specialist knowledge of database structure and data relationships is required in order to set up a graphic report. Since graphic reports often make use of SQL queries, a good understanding of SQL syntax is also required.
Design Tips
It is always a good idea to give the design of your report some careful thought before starting. Here are a few pointers:
- Decide on a suitable paper size and orientation for the design sheets of the report. Make a rough sketch (preferably on a piece of graph paper) showing headings and approximate positioning of templates.
- Set up Style Sheet so that you have consistent fonts through the report. Your company may have guidelines on this.
- Decide on the type of templates you want to use and what the Data Source(s) for each template will be.
- Make a note of the names of all of the tables (including lookup tables) that will be accessed.
- Identify any queries that may be required and use the query configuration tools to build and test them.
- Examine the data relationships. At this stage, you should identify the controlling dataset and decide on the master/detail links for other datasets.
The following diagram illustrates the layout of a typical graphic drillhole log.
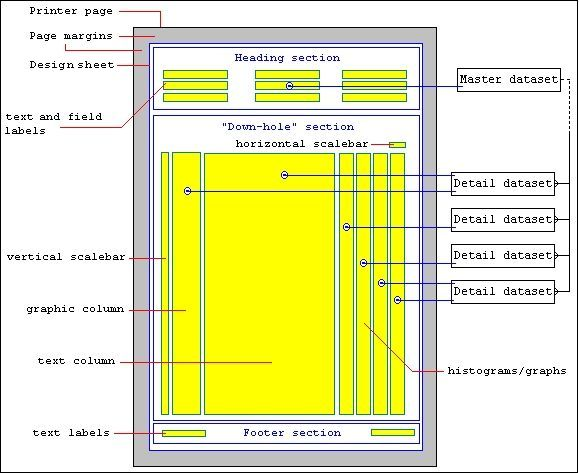
The templates (objects shown in yellow) derive their data from the datasets, which are set up in a master/detail relationship. In this case, the master dataset the drillhole header table, while the detail datasets are tables or queries which retrieve geology, mineralisation, alteration, etc. for the current drillhole.
A single dataset can be used to populate several templates.